3-26-20 saw the market on the third day of a rebound from the low of 18213 on 3-23-20. The chart below shows the Fibonacci retracements from the recent high to this low.
The retracement hit the 38.2% level and this level can offer resistance. The market is down again and could be we are headed down to retest at or near the last low.
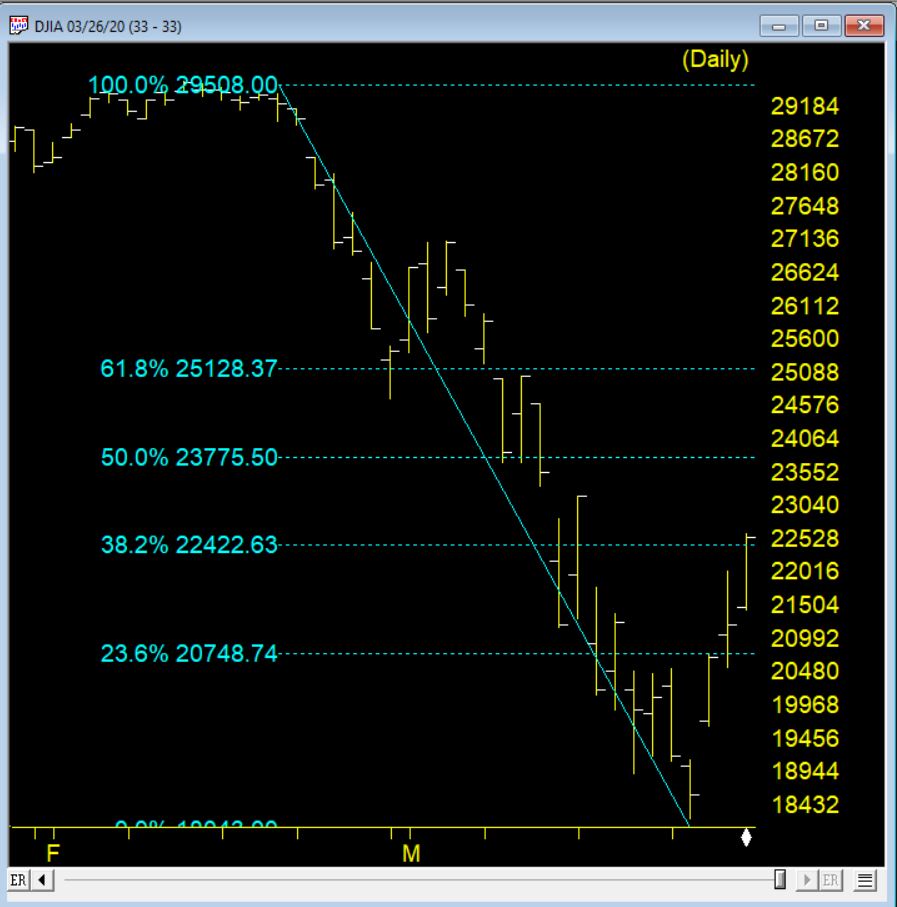
If we rally passes the 38.2% the next resistance level will be at 23775 or so at the 50% retracement level.
AIQ Market Timing signals
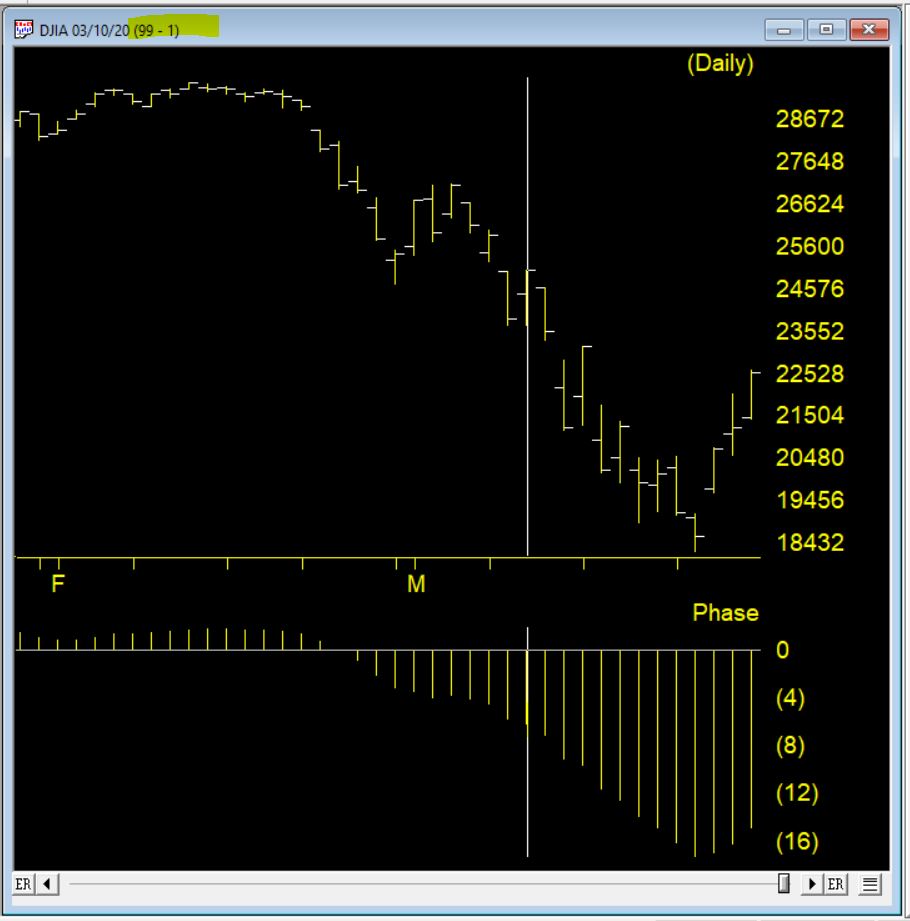
The AIQ Market Timing system issued a 99-1 up signal on 3-10-20, the chart below shows the signal. The Phase indicator changing direction in the direction of the signal (moving down then moves up) provides confirmation market Timing signals. IN this case that didn’t happen.
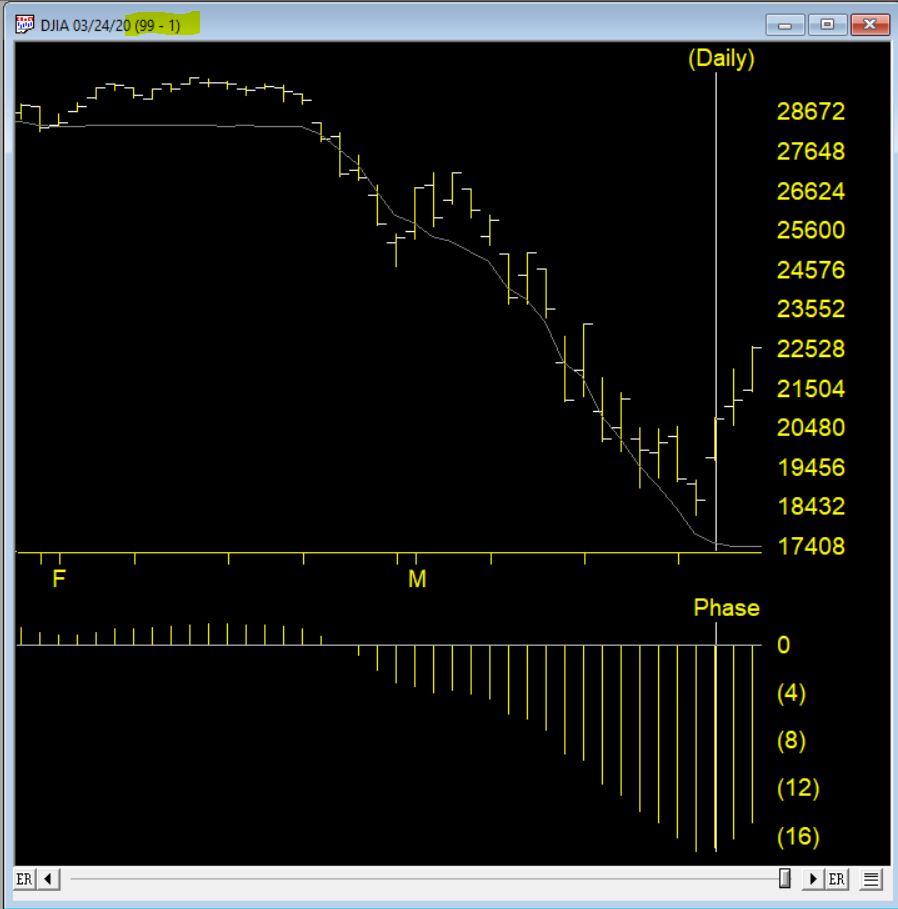
Another up signal 99-1 fired on 3-24-20 and this time the phase turned up the same day and confirmed the signal.
Here are 3 of the bullish rules that fired to create this high up signal
- The 21 day stochastic has advanced and crossed the 20% line and the price phase indicator is also increasing. In this weakly downtrending market this is taken as a strong bullish signal suggesting an increase in prices.
- Volume accumulation percentage is increasing and the 21 day stochastic has moved above the 20% line. In this downtrending market, this is taken as a strong bullish signal that could be followed by an upward price movement.
- The price phase indicator is negative but volume accumulation has started to advance. This is a non-conformation that, regardless of the type of market, is a bullish signal which usually results in an upward movement of the market.
The counter trend AI system that generates these signals can be early in their firing.