The Good News regarding the stock market is that in the long run it goes “Up”. The Bad News is that along the way there are harrowing declines (think -40% or more) as well as long stretches of 0% returns (From Dec-2000 through Sep 2011 the S&P 500 Index registered a total return of -4%. The stock market also went sideways from 1927 to 1949 and from 1965 to 1982).
Large declines and long flat periods can shatter investors financial goals and/or affect an investor’s thinking for years to come. Given the rip-roaring bull market we have seen in the last 10 years it may be wise to reiterate that “trees don’t grow to the sky.” Don’t misunderstood, I am not attempting to “call the top” (as if I could), it’s just that I have been in this business a while and – paraphrasing here – I’ve seen some “stuff.”
What follows is NOT intended to be the “be all, end all” of trading systems. In fact, since 1971 this “system” has beaten the S&P 500 Index by just a fraction. So, one might argue in the end that it is not worth the trouble. But here is the thing to consider: If you would like to earn market returns WITHOUT riding out all of the harrowing declines and the long sideways stretches – it is at least food for thought.
The Monthly LBRMomentum Strategy
There are two indicators involved: a 21-month moving average of the closing price of the S&P 500 Index and a momentum indicator that I call LBRMomentum. The calculations for LBRMomentum appear at the end of the article. LBR is an acronym for Linda Bradford Raschke as it uses a calculation that I first learned about from something written by, well – who else – Linda Bradford Raschke (If you want to learn what the life of a professional trader is all about, I highly recommend you read her book, Trading Sardines).
A Buy Signal occurs:
*When LBRMomentum drops to negative territory then turns higher for one month, AND
*SPX currently or subsequently closes above its own 21-month moving average (in other words, if LBRMomentum rise from below to above 0 while SPX is below it’s 21-month MA, then the buy signal does not occur until SPX closes above its 21-month MA)
*A Buy signal remains in effect for 18 months (if a new buy signal occurs during those 18 months then the 18-month bullish period is extended from the time of the new buy signal)
*After 18-months with no new buy signal sell stocks and move to intermediate-term treasuries until the next buy signal
See Figures 1 and 2 for charts with “Buy Signals” displayed
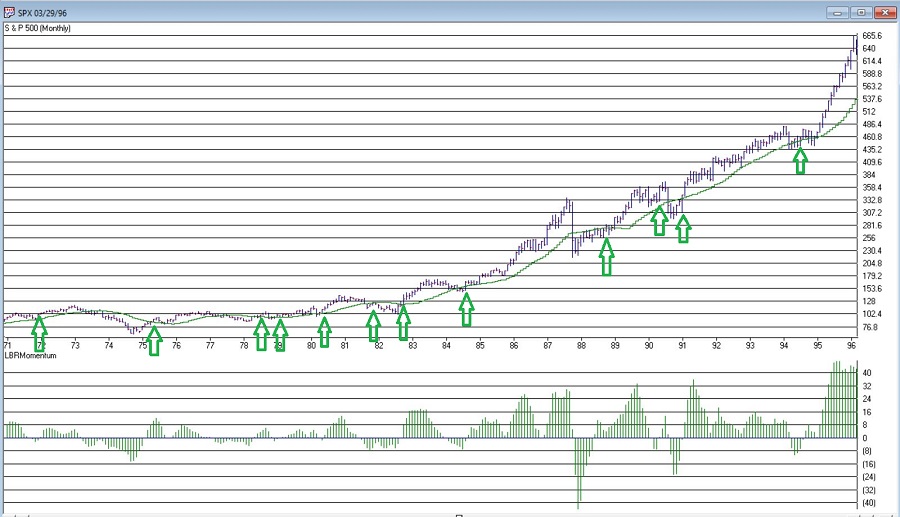
Figure 1 – LBRMomentum Buy Signals (courtesy AIQ TradingExpert)
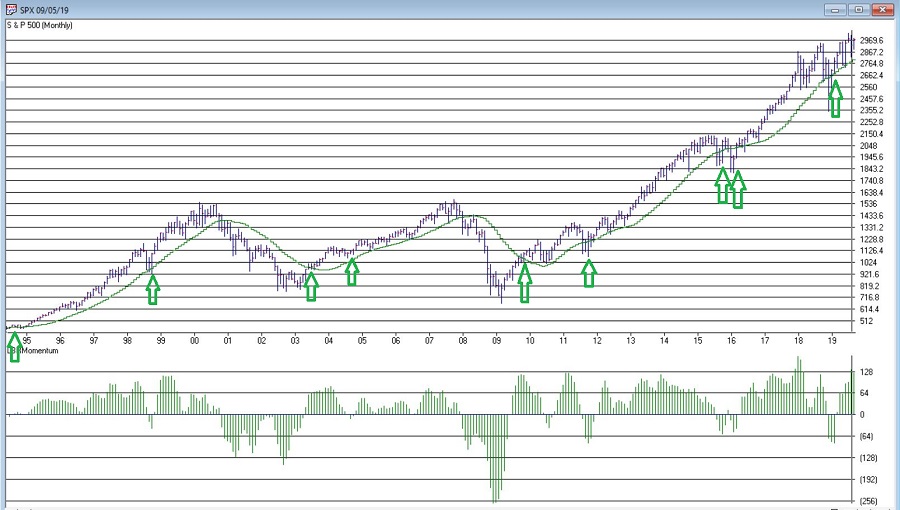
Figure 2 – LBRMomentum Buy Signals (courtesy AIQ TradingExpert)
Figure 3 displays the cumulative total return for both the “System” and buying-and-holding SPX. As I mentioned earlier, following the huge bull market of the past 10 years the next results are roughly the same (Strategy = +11,769, buy-and-hold = +11,578%).
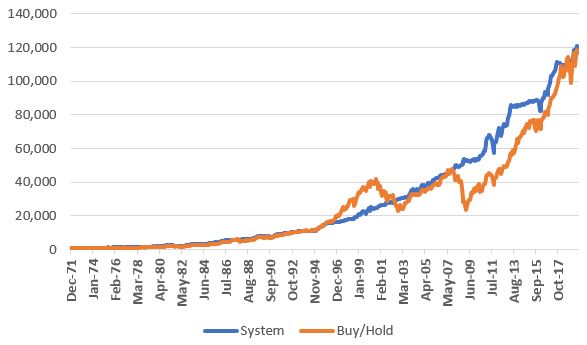
Figure 3 – Growth of $1,000 invested using LBRMomentum System (blue line) versus S&P 500 Index buy-and-hold; 1971-2019
But to get a sense of the potential “Let’s Get Some Sleep at Night” benefits of the System, Figure 4 displays the growth of $1,000 invested in the S&P 500 ONLY when the System is bullish.
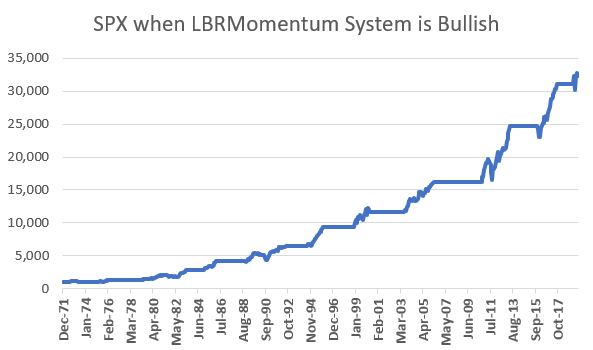
Figure 4 – Growth of $1,000 invested in SPX ONLY while LBRMometnum System is Bullish
Figure 5 displays the growth of $1,000 invested in the Bloomberg Barclays Treasury Intermediate Index ONLY when the LBRMomentum System is NOT bullish.
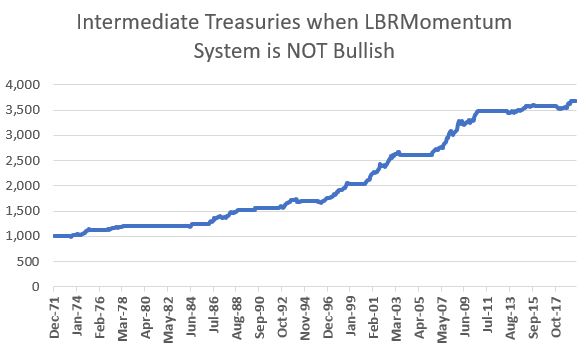
Figure 5 – Growth of $1,000 invested in SPX ONLY while LBRMometnum System is NOT Bullish
The things to notice about Figures 4 and 5 are:
a) the lack of significant drawdowns and,
b) the lack of long periods with no net gain.
In other words, this approach represents the Tortoise and not the Hare. The intent is not so much to “Beaten the Market” but rather to avoid being “Beaten Up by the Market.”
Figure 6 displays some relevant comparative performance figures.
| Measure | System | Buy/Hold |
| CAGR % | 10.06% | 10.03% |
| Std. Deviation% | 10.2% | 16.7% |
| CAGR/StdDev | 0.98 | 0.60 |
| Worst 12 mo. % | (-15.5%) | (-43.3%) |
| Maximum Drawdown % | (-17.6%) | (-50.9%) |
| % 12-month periods UP | 93% | 80% |
| % 5-Yr. periods UP | 100% | 89% |
Figure 6 – Performance Figures
Note that the Compounded Annual Growth Rate is virtually the same. However, the System clearly experienced a great deal less volatility along the way with a significantly lower standard deviation as well as far lower drawdowns (-17.6% for the System versus -50.9% for buy-and-hold). Note also that the System showed a 12-month gain 93% of the time versus 80% of the time for buy-and-hold. The System also showed a gain 100% of the time over 5-year periods (versus 89% of the time for buy-and-hold).
The last “Buy Signal” occurred on 3/31/2019 and will remain in effect until 9/30/2020.
For the record, this “System” has significantly underperformed buy-and-hold over the past 10 years. Still, if earning a market return over the long-term – without worrying as much about massive declines and long, flat stretches is appealing – it is food for thought.
LBR Momentum
LBRMomentum simply subtracts the 10-period moving average from the 3-month moving average as shown in the code below
LBRMomentum is simpleavg([close], 3) – simpleavg([close], 10).
Jay Kaeppel
Disclaimer: The data presented herein were obtained from various third-party sources. While I believe the data to be reliable, no representation is made as to, and no responsibility, warranty or liability is accepted for the accuracy or completeness of such information. The information, opinions and ideas expressed herein are for informational and educational purposes only and do not constitute and should not be construed as investment advice, an advertisement or offering of investment advisory services, or an offer to sell or a solicitation to buy any security.