Category Archives: stock market

Bartometer

April 10, 2021

Hello Everyone,

The stock markets continue to rise over the last month with the Value sector leading the way. The energy, financial, airlines, cruise ship sector and more have followed right along the last few months as well. Over the short term the Value sector still looks good going forward with the recovery of the economy and the realization that the Covid 19 virus will soon subside. I still like the growth sector involving technology over the longer term, but the sector that should outperform shorter term as the economy is recovering is the value sector. On the Bartometer at the end of last year I thought the S&P 500 would hit 4200-4400. As of Friday the S&P was 4094. My AIQ Trading Expert and my other technical computer algorithms are still at a BUY-HOLD signal. Remember that this market is very overvalued and is selling at 24 times earnings, and is currently 21% overvalued based on earnings and interest rates.. Earnings growth has to be great for this market to continue higher.

Interest rates have climbed to the 1.7% level on the 10-year government bond. Bonds, in general, have fallen this year from 0-to 13%, with Floating rate bonds actually rising 2% in 2021. Floating rate bonds and variable interest rate bonds both pay a higher rate as interest rates rise. The interest rate rise over the short term should be more subdued based on Federal Chairman Reserve Powell’s testimony that he is dovish on interest rate rises. I believe over the longer term with the deficit continuing to rise that the market will push interest rates higher. I also believe that inflationary pressures will also push the need for interest rates to rise over the next year or two. Allocations for bonds in your portfolio should be more concentrated in shorter duration, and in the floating rate bond sector/ Treasury inflation-protected Strips or TIPS. Please call me to strategize your portfolio holistically.

Some of the INDEXES of the markets both equities and interest rates are below. The source is Morningstar.com up until April 09, 2021.

Dow Jones +10.97%
S&P 500 +10.0%
EQUAL WEIGHTED S&P 500 +14%
NASDAQ Aggressive growth +7.58%
Large Cap Value +9.68%
I Shares Russell 2000 ETF (IWM) Small cap +13.34%
Midcap stock funds +14.0%
International Index (MSCI – EAFE ex USA +9%
International Emerging Markets +3.6%
Financial stocks +13%
Energy stocks +28%
Healthcare Stocks +.9% Moderate Mutual Fund Investment Grade Bonds (AAA) Long duration +5.1%
High Yield Merrill Lynch High Yield Index +1.4% Floating Rate Bond Funds +1.7%
Short Term Bond +.0%
Multi sector bond funds +.3% Gold -8.43% Long Term 20 year Bond fund -12% 10 year Bond Yield 1.62%

Classicalprinciples.com and Robert Genetskis Excerpts

Market Outlook

Stocks turned in a mixed performance this past week. The Nasdaq and QQQs had the biggest gains while the S&P500 and Dow rose to new all-time highs. In contrast, small-cap stocks fell ½%. Weekly moves show stocks rotating into and out of different areas, while the overall market trend continues to be positive.

The main force behind the upward move is a highly expansive Fed policy. Monetary stimulus creates a surplus of liquidity for stocks and ignited gains in business activity. This week’s sharp reversal in longer-term interest rates provided another spark for sending prices higher

The Biden Administration tried to discourage investors by proposing more destructive policies. Investors were not discouraged. Cautious statements by some Democrats are viewed as a possible barrier to the more these destructive policy proposals. The Fed continues to add kindling to the inflationary fire and promises it will continue to do so. Although longer-term interest rates moved lower this past week, implied inflation expectations remain high. The implied inflation expectation is currently 2.3%. It is measured by subtracting the inflation-adjusted 10-year T-bond yield from the actual 10-year T-bond yield.

Although core inflation rates remain very low, the bond market expects higher inflation. The market is more reliable. As for stocks, the gains in the S&P500 move the index to 21% above fundamental value.

Stocks are overextended and the risks of a reversal, or at least a leveling off, are rising. In spite of the heightened risks and the likelihood for some temporary setback, ongoing monetary stimulus has the potential to continue to drive stock prices higher.

Stock Valuation: S&P 500 21% Overvalued
Economic Fundamentals: Positive
Monetary Policy; Highly Expansive
.
Source: Classical Principles.com

S & P 500

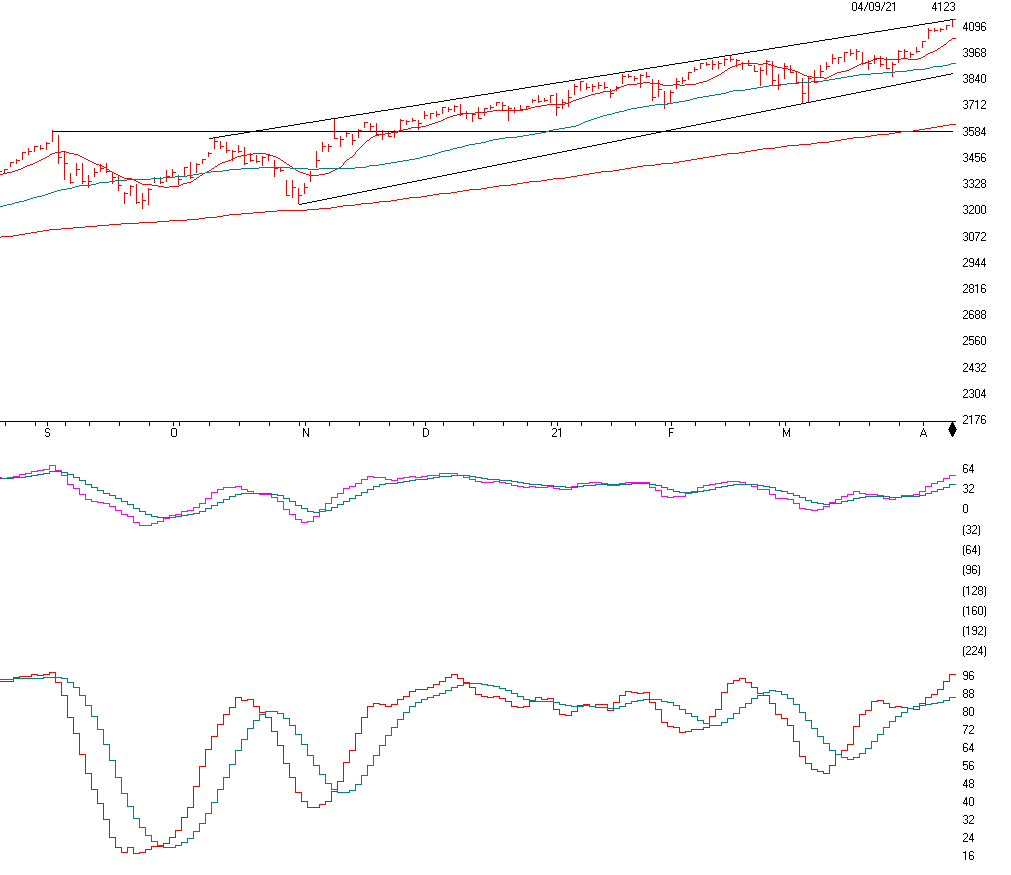
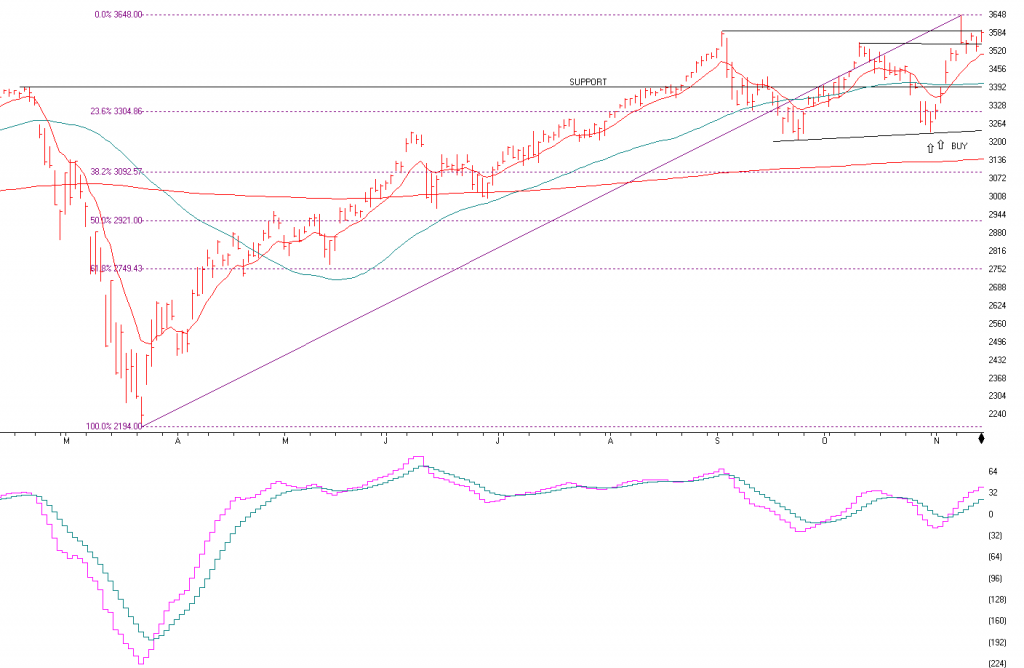
The market weighted S&P 500 which weights the largest companies like Apple, Microsoft, Google and more. This index is up 10% in 2021. 500 of the largest stocks in the USA are in this index. If you look to thchart above you will see an ASCENDING CHANNEL. An ascending channel is Bullish and if it breaks out above the top of the channel it can signal a Continuation of the move higher. Many times the market will top out at the top of the channel, right where it is now. If it breaks down below the channel then it can signal a possible trend change. There is a definite channel trend here HIGHER. But could have a short term setback here.

The indicator below the price chart is the MACD, or momentum indicator has turned to the upside, See the pink line breaking out of the blue line, another Bullish signal

The bottom indicator is SD-SK Stochastics is now above the 88 line and clearing shows an overbought situation in the stock market. Even though the market indicators are BULLISH, and 21% overvalued, we have to be wondering when all of this upside will stop. I thought 4200 to 4400 on the S&P 500. That is a 2-7% move from here. It can go higher than that, we will see. Earnings are coming out and if they show a clear cut blowout in earnings then the market should continue higher, but we have to keep aware of the overvalued nature of the market.

Chart Source: AIQsystems.com

Support levels

S&P 500 4040, 3919, 3870, 3655.
NASDAQ 13,611, 13,472, 13012.
Dow Jones 33280, 29280
These may be safer areas to get into the equity markets on support levels slowly on the accumulation areas.

THE BOTTOM LINE:

The market continues to look ok albeit very overvalued based on earnings and interest rates. I still think the market could reach my 4200-4400 or higher before the end of the year or higher and the economy should be higher than where we are today. I am worried that interest rates over the next year or so will be higher than 2% on the ten-year bond. Markets usually have a more serious correction if the 10-year bond goes above 2.75% to 3%. We are far from that point. I still like Value stocks for the short term and growth for the mid to long term as growth stocks is where the real growth in the economy should be. The NASDAQ stocks have underperformed for the year but, if you are longer-term investors then have a mix of growth and Value stocks or funds. I have been suggesting a higher percentage of small and midcap value and growth funds over the last 5 months and now the smaller stocks are overvalued and a reduction of smaller stocks may be in order. In addition, the Price to Earnings in the market is over 24 times earnings, this indicates a much-overvalued market. If you are within a year of retirement you may want to take some profits if you made money and wait for a better entry. It all depends on your goals and risk tolerance.

Best to all of you,

Joe Bartosiewicz, CFP®
Investment Advisor Representative

Securities and advisory services offered through SagePoint Financial, Inc. (SPF), member FINRA/SIPC. SPF is separately owned and other entities and/or marketing names, products or services referenced here are independent of SPF. 800-552-3319 20 East Thomas Road Ste 2000 Phoenix AZ 85012

If you have any questions, please call me at 860-940-7020.
Joe Bartosiewicz, CFP®
92 High Street
Thomaston, CT 06787 and
7501 East MCDowell RD #2172 Scottsdale, AZ 85257

Disclaimer: The views expressed are not necessarily the view of Sage Point Financial, Inc. and should not be interpreted directly or indirectly as an offer to buy or sell any securities mentioned herein. Securities and Advisory services offered through Sage Point Financial Inc., Member FINRA/SIPC, an SEC-registered investment advisor.
Past performance cannot guarantee future results. Investing involves risk, including the potential loss of principal. No investment strategy can guarantee a profit or protect against loss in periods of declining values. Please note that individual situations can vary. Therefore, the information presented in this letter should only be relied upon when coordinated with individual professional advice. *There is no guarantee that a diversified portfolio will outperform a non-diversified portfolio in any given market environment. No investment strategy, such as asset allocation, can guarantee a profit or protect against loss in periods of declining values.
It is our goal to help investors by identifying changing market conditions. However, investors should be aware that no investment advisor can accurately predict all of the changes that may occur in the market.

The price of commodities is subject to substantial price fluctuations of short periods and may be affected by unpredictable international monetary and political policies. The market for commodities is widely unregulated, and concentrated investing may lead to Sector investing may involve a greater degree of risk than investments with broader diversification.
Indexes cannot be invested indirectly, are unmanaged, and do not incur management fees, costs, and expenses.
Dow Jones Industrial Average: A weighted price average of 30 significant stocks traded on the New York Stock Exchange and the NASDAQ.
S&P 500: The S&P 500 is an unmanaged indexed comprised of 500 widely held securities considered to be representative of the stock market in general.
NASDAQ: the NASDAQ Composite Index is an unmanaged, market-weighted index of all over the counter common stocks traded on the National Association of Securities Dealers Automated Quotation System
(IWM) I Shares Russell 2000 ETF: Which tracks the Russell 2000 index: which measures the performance of the small capitalization sector of the U.S. equity market.
A Moderate Mutual Fund risk mutual has approximately 50-70% of its portfolio in different equities, from growth, income stocks, international and emerging markets stocks to 30-50% of its portfolio in different categories of bonds and cash. It seeks capital appreciation with a low to moderate level of current income.
The Merrill Lynch High Yield Master Index: A broad-based measure of the performance of non-investment grade US Bonds
MSCI EAFE: the MSCI EAFE Index (Morgan Stanley Capital International Europe, Australia, and Far East Index) is a widely recognized benchmark of non-US markets. It is an unmanaged index composed of a sample of companies’ representative of the market structure of 20 European and Pacific Basin countries and includes reinvestment of all dividends.
Investment grade bond index: The S&P 500 Investment-grade corporate bond index, a sub-index of the S&P 500 Bond Index, seeks to measure the performance of the US corporate debt issued by constituents in the S&P 500 with an investment-grade rating. The S&P 500 Bond index is designed to be a corporate-bond counterpart to the S&P 500, which is widely regarded as the best single gauge of large-cap US equities.
Floating Rate Bond Index is a rule-based, market-value weighted index engineered to measure the performance and characteristics of floating-rate coupon U.S. Treasuries, which have a maturity greater than 12 months.

The Bartometer

November 14, 2020

Hello Everyone,

Well, the election is over and and if Trump doesn’t win the contested vote then Biden is President. My biggest concern going forward is the race in Georgia that could switch the control of the senate to the Democrats enabling them unchecked control in the government. If this happens, and Democrats get rid of the filibuster rule there could be volatily in the stock and bond markets because: It could increase taxes on corporations, raise capital gains taxes and estate taxes by reducing the couple estate tax exclusion from $11 million to $3.5 milllion.

If the Democrats don’t win then there will be gridlock, and gridlock meaning that many of the tax increases may not pass. We will see what happens on January 5th 2021. Currently my Technical Analysis computer is still on a Buy-Hold as of about a week to 2 weeks ago, but it changes daily.

The increases in the Covid 19 virus is again causing Governors in many states to restrict access to non-essential business. This will reduce earnings of many corporations but increase the earnings of technology companies that are benefitting by people using their goods and services from home. Once a safe and effective vaccine is created by either Pfizer or Moderna, and when people feel safe to travel/use the goods and services of non essential companies will they prevail. then the Value stocks, eg., the cruise lines, airlines, resorts, restaurants, retail, manufacturing, telecommunications and more should rise. Until that time, the market will be volatile.

We are now in a seasonally strong time for the stock markets, but with the overhang of the senate election in Georgia, and the increase in Covid 19 coupled with the upcoming Flu season, caution is still somewhat appropriate. For people who are more Cautious in general, but over the next 1-2 years I still think the market could go higher even though the market is about 6% overvalued mostly because of the technology stocks. When the pandemic is even close to nearing its conclusion, the Value sector should continue its rise. So, small, mid and large value stocks could be the bigger winner, and if we get a selloff because of Covid 19, I will be buying those sectors.

Some of the INDEXES of the markets both equities and interest rates are below. The source is Morningstar.com up until Novemeber 14, 2020. These are passive indexes.

Dow Jones +5.1%
S&P 500 +12.2%
EQUAL WEIGHTED S&P 500 +3.1%
NASDAQ Aggressive growth +29%
Large Cap Value -3.0%
I Shares Russell 2000 ETF (IWM) Small cap +5.2%
Midcap stock funds -4.66
International Index (MSCI – EAFE ex USA +2%
Financial stocks -10%
Energy stocks -36%
Healthcare Stocks +11%

Moderate Mutual Fund Investment Grade Bonds (AAA) Long duration +6.5%
igh Yield Merrill Lynch High Yield Index +1.9%

Floating Rate Bond Funds -.60%
Short Term Bond +1.6%
Mutli sector bond funds +2.3%

I do expect potential major volatility over the next few months if the Republicans lose the Senate.

Classicalprinicples.com and Robert Genetskis Excerpts

Market Outlook

Stocks were mixed this past week. The previously out-of-favor small caps rose 3%-4%, when the Nasdaq and QQQs fell 2%-3%. The Dow and S&P500 gained 1%-2%. I expect stocks to continue to consolidate within the range of the past five months. Biden’s choice of advisors is interesting. His Chief of Staff was the one in charge of fighting Ebola. He admitted they had made every mistake imaginable in that fight. Another medical advisor says the country should lock down for 4-6 weeks and can simply pay workers and businesses for lost income. Just what Biden needs… another advisor with no concept of economics feeding him mush. It’s important to pay attention to Biden’s advisors. Their ideas can provide a clue to just how crazy things can get. Hopefully, cooler heads will prevent the chaos that would result from such complete nonsense.

A Look Back

The latest weekly data show the labor market continues to improve in spite of Covid. Initial unemployment claims fell to 709,000 in the first week of this month. This is down about 140,000 from the previous month. For the final week in October, the insured unemployment rate fell to 4.6%, down from 7.5% from the previous month. The number of people receiving insured unemployment payments fell to 6.8 million. There were close to 11 million a month ago.

What to expect this coming week

Look for the economic numbers to continue to show the economy performing well. Tuesday’s report for manufacturing in October should be a strong one. Business surveys show manufacturing production increasing dramatically in October. Hence, the Fed’s manufacturing number should be up substantially.

Source: Classical Principles.com

S&P 500 Chart Source: AIQsystems.com

The S&P 500 is above. As you can see my computer models gave a BUY signal on 10/30/20 and another one a couple days later. Another Bullish sign is when it broke above the middle of the W pattern. This is BULLISH unless it breaks down below that breakout. Now it has to breakout from the old high of 3648. If it does with conviction volume watch the 3750 area for some resistance. But it has to breakout from 3648 with a lot of volume first.

We are now in a bullish seasonal pattern for the market. One year from now I think the economy will do much better than it is now and the markets should be higher as well.

MACD or Momentum is still Bullish as the pink line has broken out of the blue line showing positive momentum.

Support levels on the S&P 500 area are 3546, 3392-3405, 3306 and 3244. 3143 is 200 Day Moving average
NASDAQ Support, 11621, 11300-11360, 11062. Resistance is 12075
These may be safer areas to get into the equity markets on support levels slowly on the accumulation areas.

THE BOTTOM LINE:

The market has rebounded nicely over the last month mainly because of earnings of companies beating expectations. The NASDAQ has done the best this year and should continue to do well IF the market continues higher. Now that the vaccine is a reality the value stocks should start to rise. You may want to call me to review everything including your 401(k) to determine the best allocation going forward. I like the USA market better than the international market.

Best to all of you,

Joe Bartosiewicz, CFP®
Investment Advisor Representative

92 High Street
Thomaston, CT 06787
860-940-7020

Securities and advisory services offered through SagePoint Financial, Inc. (SPF), member FINRA/SIPC. SPF is separately owned and other entities and/or marketing names, products or services referenced here are independent of SPF. 800-552-3319 20 East Thomas Road Ste 2000 Phoenix AZ 85012

Charts provided by AIQ Systems:

Technical Analysis is based on a study of historical price movements and past trend patterns. There is no assurance that these market changes or trends can or will be duplicated shortly. It logically follows that historical precedent does not guarantee future results. Conclusions expressed in the Technical Analysis section are personal opinions: and may not be construed as recommendations to buy or sell anything.

Disclaimer: The views expressed are not necessarily the view of Sage Point Financial, Inc. and should not be interpreted directly or indirectly as an offer to buy or sell any securities mentioned herein. Securities and Advisory services offered through Sage Point Financial Inc., Member FINRA/SIPC, an SEC-registered investment advisor.

Past performance cannot guarantee future results. Investing involves risk, including the potential loss of principal. No investment strategy can guarantee a profit or protect against loss in periods of declining values. Please note that individual situations can vary. Therefore, the information presented in this letter should only be relied upon when coordinated with individual professional advice. *There is no guarantee that a diversified portfolio will outperform a non-diversified portfolio in any given market environment. No investment strategy, such as asset allocation, can guarantee a profit or protect against loss in periods of declining values.
It is our goal to help investors by identifying changing market conditions. However, investors should be aware that no investment advisor can accurately predict all of the changes that may occur in the market.

The price of commodities is subject to substantial price fluctuations of short periods and may be affected by unpredictable international monetary and political policies. The market for commodities is widely unregulated, and concentrated investing may lead to Sector investing may involve a greater degree of risk than investments with broader diversification.

Indexes cannot be invested indirectly, are unmanaged, and do not incur management fees, costs, and expenses.

Dow Jones Industrial Average: A weighted price average of 30 significant stocks traded on the New York Stock Exchange and the NASDAQ.

S&P 500: The S&P 500 is an unmanaged indexed comprised of 500 widely held securities considered to be representative of the stock market in general.

NASDAQ: the NASDAQ Composite Index is an unmanaged, market-weighted index of all over the counter common stocks traded on the National Association of Securities Dealers Automated Quotation System

(IWM) I Shares Russell 2000 ETF: Which tracks the Russell 2000 index: which measures the performance of the small capitalization sector of the U.S. equity market.

A Moderate Mutual Fund risk mutual has approximately 50-70% of its portfolio in different equities, from growth, income stocks, international and emerging markets stocks to 30-50% of its portfolio in different categories of bonds and cash. It seeks capital appreciation with a low to moderate level of current income.

The Merrill Lynch High Yield Master Index: A broad-based measure of the performance of non-investment grade US Bonds

MSCI EAFE: the MSCI EAFE Index (Morgan Stanley Capital International Europe, Australia, and Far East Index) is a widely recognized benchmark of non-US markets. It is an unmanaged index composed of a sample of companies’ representative of the market structure of 20 European and Pacific Basin countries and includes reinvestment of all dividends.

Investment grade bond index: The S&P 500 Investment-grade corporate bond index, a sub-index of the S&P 500 Bond Index, seeks to measure the performance of the US corporate debt issued by constituents in the S&P 500 with an investment-grade rating. The S&P 500 Bond index is designed to be a corporate-bond counterpart to the S&P 500, which is widely regarded as the best single gauge of large-cap US equities.

Floating Rate Bond Index is a rule-based, market-value weighted index engineered to measure the performance and characteristics of floating-rate coupon U.S. Treasuries, which have a maturity greater than 12 months.


Good Companies, Troubled Stocks and Potential Opportunity

Truth be told I am not much of a “stock picker”. Oh, I can pick ‘em alright just like anyone else.  They just to don’t go the right way as often as I’d like.  I also believe that the way to maximize profitability is to follow a momentum type approach that identifies stocks that are performing well and buying them when they breakout to the upside (ala O’Neil, Minervini, Zanger, etc.) and then riding them as long as they continue to perform.  Unfortunately, I’m just not very good at it. 

Back when I started out, there was such a thing as a “long-term investor.”  People would try to find good companies selling at a decent price and they would buy them and hold them for, well, the long-term.  Crazy talk, right? As I have already stated, I am not claiming that that is a better approach. I am just pointing out that it was “a thing.”

An Indicator

There is an indicator (I will call it VFAA, which is short for vixfixaverageave, which – lets face it – is a terrible name) that I follow that was developed as an extension of Larry William’s VixFix Indicator.  There is nothing magic about it.  Its purpose is to identify when price has reached an exceptionally oversold level and “may” be due to rally.  The code for this indicator appears later.

For the record, I DO NOT systematically use this indicator in the manner I am about to describe, nor am I recommending that you do.  Still, it seems to have some potential value, so what follows is merely an illustration for informational purposes only.

The Rules

*We will look at a monthly bar chart for a given stock

*A “buy signal” occurs when VFAA reaches or exceeds 80 and then turns down for one month

*A “sell (or exit) signal” occurs when VFAA subsequently rises by at least 0.25 from a monthly closing low

Seeing as how this is based solely on monthly closes it obviously this is not going to be a “precision market timing tool.”

Some “Good Companies” with “Troubled Stocks”

So now let’s apply this VFAA indicator to some actual stocks.  Again, I AM NOT recommending that anyone use this approach mechanically.  The real goal is merely to try to identify situations where a stock has been washed out, reversed and MAY be ready to run for a while.

Ticker BA

Figure 1 displays a monthly chart for Boeing (BA) with VFAA at the bottom.  The numbers on the chart represent the hypothetical + (-) % achieved by applying the rules above (although once again, to be clear I am not necessarily suggesting anyone use it exactly this way). 

Figure 1 – Ticker BA with VFAA (Courtesy AIQ TradingExpert)

From March 2019 into March 2020 BA declined -80%.  It has since bounced around and VFAA has soared to 110.88.  VFAA has yet to rollover on a month-end basis, so nothing to do here except exhibit – what’s that word again – oh right, “patience.”

Ticker GD

Figure 2 displays a monthly chart for General Dynamics (GD) with VFAA at the bottom. 

Figure 2 – Ticker GD with VFAA (Courtesy AIQ TradingExpert)

Are these “world-beating numbers”?  Not really.  But in terms of helping to identify potential opportunities, not so bad. VFAA gave a “buy signal” for GD at the end of July. So far, not so good as the stock is down about -6%.

Ticker WFC

Figure 3 displays a monthly chart for Wells Fargo (WFC) with VFAA at the bottom. 

Figure 3 – Ticker WFC with VFAA (Courtesy AIQ TradingExpert)

There are not many “signals” but the ones that occurred have been useful. Between 2018 and 2020 WFC declined -65%.  It has since bounced around and VFAA has soared to 102.44.  VFAA has yet to rollover on a month-end basis. But at some point it will, and a potential opportunity may arise.

VFAA Formula

Below is the code for VFAA

VixFix is an indicator developed many years ago by Larry Williams which essentially compares the latest low to the highest close in the latest 22 periods (then divides the difference by the highest close in the latest 22 periods).  I then multiply this result by 100 and add 50 to get VixFix.

*Next is a 3-period exponential average of VixFix

*Then VFAA is arrived at by calculating a 7-period exponential average of the previous result (essentially, we are “double-smoothing” VixFix)

Are we having fun yet?  See code below:

hivalclose is hival([close],22).

vixfix is (((hivalclose-[low])/hivalclose)*100)+50.

vixfixaverage is Expavg(vixfix,3).

vixfixaverageave is Expavg(vixfixaverage,7).

VFAA = vixfixaverageave

EDITORS NOTE: The AIQ Expert Design Studio code for the indicator is available to download from here. Save this file to your /wintes32/EDS Strategies folder https://aiqeducation.com/VFAA.EDS

Summary

One thing to note is that VFAA “signals” on a monthly chart don’t come around very often.  So, you can’t really sit around and wait for a signal to form on your “favorite company”.  You have to look for opportunity wherever it might exist.

One last time let me reiterate that I am not suggesting using VFAA as a standalone systematic approach to investing. But when a signal does occur – especially when applied to quality companies that have recently been “whacked”, it can help to identify a potential opportunity.

Jay Kaeppel

Disclaimer: The information, opinions and ideas expressed herein are for informational and educational purposes only and are based on research conducted and presented solely by the author.  The information presented represents the views of the author only and does not constitute a complete description of any investment service.  In addition, nothing presented herein should be construed as investment advice, as an advertisement or offering of investment advisory services, or as an offer to sell or a solicitation to buy any security.  The data presented herein were obtained from various third-party sources.  While the data is believed to be reliable, no representation is made as to, and no responsibility, warranty or liability is accepted for the accuracy or completeness of such information.  International investments are subject to additional risks such as currency fluctuations, political instability and the potential for illiquid markets.  Past performance is no guarantee of future results.  There is risk of loss in all trading.  Back tested performance does not represent actual performance and should not be interpreted as an indication of such performance.  Also, back tested performance results have certain inherent limitations and differs from actual performance because it is achieved with the benefit of hindsight.

Quick Market update video

The Expert System in TradingExpert Pro gave a 1 – 99 down signal on the Dow Jones on 8-27-20. The market internals based on the advancing vs declining issue in the New York market continue to diverge from the market price action.

The phase indicator used to confirm Expert Ratings turned down on 8-31-20. We usually look for a phase confirmation of an Expert Rating to occur within 3 days of the rating.

The changes made in the constituents of the Dow 30 effective 8-31-20

  • Salesforce.com replaced Exxon Mobil, Amgen replacedd Pfizer and Honeywell replaced Raytheon Technologies.
  • The changes were due to Apple’s 4-for-1 stock split, which significantly reduced the indexes exposure to the information technology sector.
  • The Dow 30 is a price weighted index.

Dow 30 MACD picture – Dotcom vs Covid

You may have seen some of the articles out there analyzing the skewed nature of the current market rally. As Joe Bartosiewicz in his August 8 Bartometer pointed out:

“The Top 15 Stocks in the S&P 500 account in Market Value 35% of the entire S&P 500 stock market. The Bottom 420 Stocks in the S&P 500 account in Market Value 33.8% of the entire S&P 500 stock market. This means that 15 stocks are controlling the entire S&P 500..”

The Dow Jones 30 index uses a price weighted criteria as part of it’s calculation, and also includes Apple; AAPL has more than doubled in price in under 5 months.

Given that there appears to be only a small basket of stocks leading this rally, we had a look back at the last time tech related stocks were driving the market higher; the dotcom bubble that ran through the 90s into the early 00s.

Monthly DJIA and MACD – left through 3/2002 – right through 10/2002

The first chart is a monthly of the Dow 30 with MACD indicator comparing the market 03/29//2002 as the dotcom bubble rolled over vs 7 months later. Students of divergence analysis, will tell you that MACD in late March 2002 clearly showed prices should be much lower still despite the @33 % rally from the September 2001 low. By late October 2002 the market had fallen again by @33%. At that time the market was close to @40% lower than the high at the start of 2000.


Monthly DJIA and MACD – left through 3/2002 – right through 8/2020

The second chart is a monthly of the Dow 30 on the right through 8/10/20 vs the rally peak of 03/29/2002. The current market has had a @50% rally from the low at the end of March 2020. The original correction was @37% from high to low, slightly bigger than the dotcom correction. The MACD, similar to 2002, is strongly diverging.

The decline in 2002, after the rally, took prices lower than the the prior bottom. If a similar pattern happens this time and the decline is @40% from the high of 29568, the Dow would at the 17700 level.