Category Archives: Stock trading

All Eyes on Key Bellwether Support Levels

First the reality.  Nobody knows what the market is going to do.  Yes, I am aware that there are roughly a bazillion people out there “prognosticating” (myself included) about the stock market.  And yes, if one makes enough “predictions”, the law of averages dictates that one will be correct a certain percentage of the time.

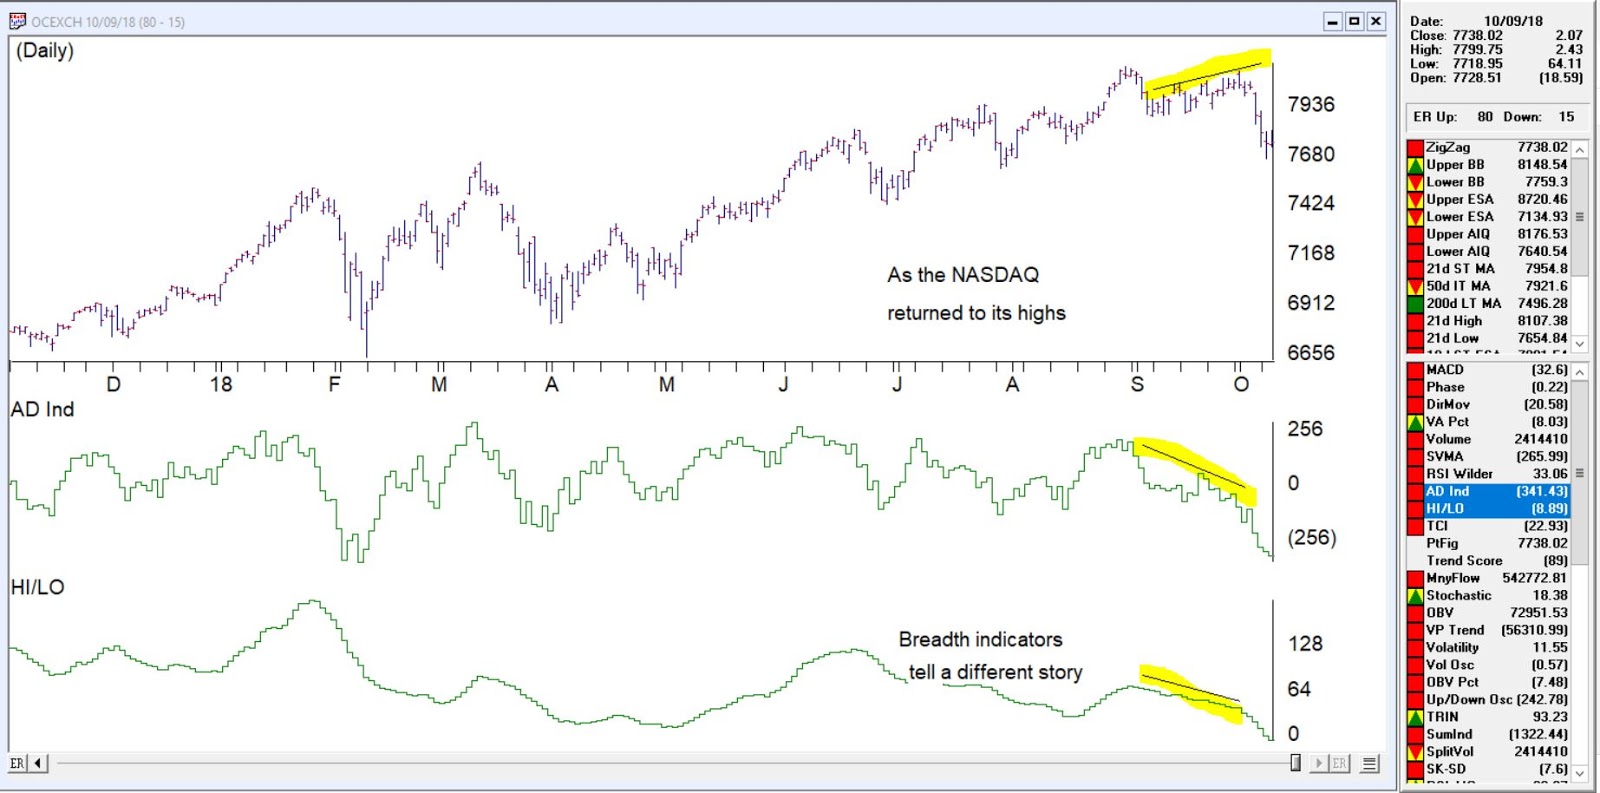
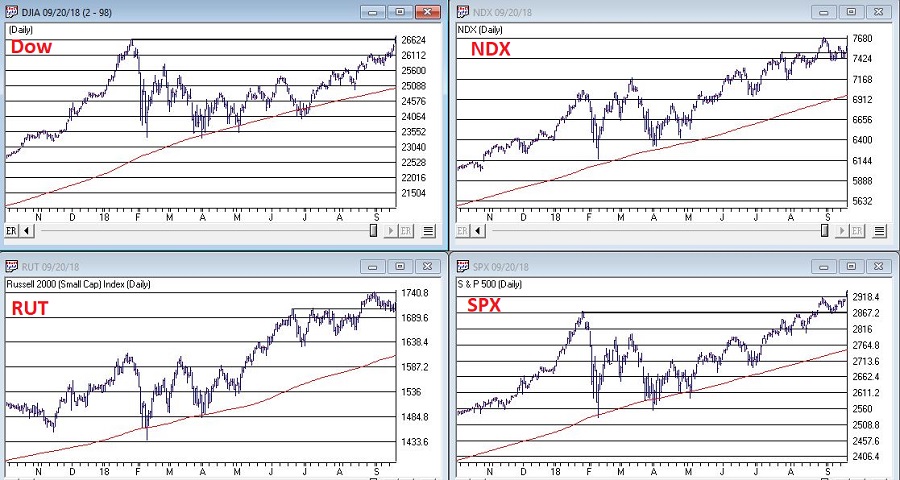
Still, the market does offer clues.  Sometimes those clues turn out to be false leads.  But sometimes they do offer important information.  For example, Figure 1 displays four major market indexes.  As you can see, in the Aug-Sep-Oct time frame all four of these averages “broke out” to new all-time highs (i.e., The Good News) and then broke back down below the previous resistance line drawn on each chart (i.e., The Bad News).

1

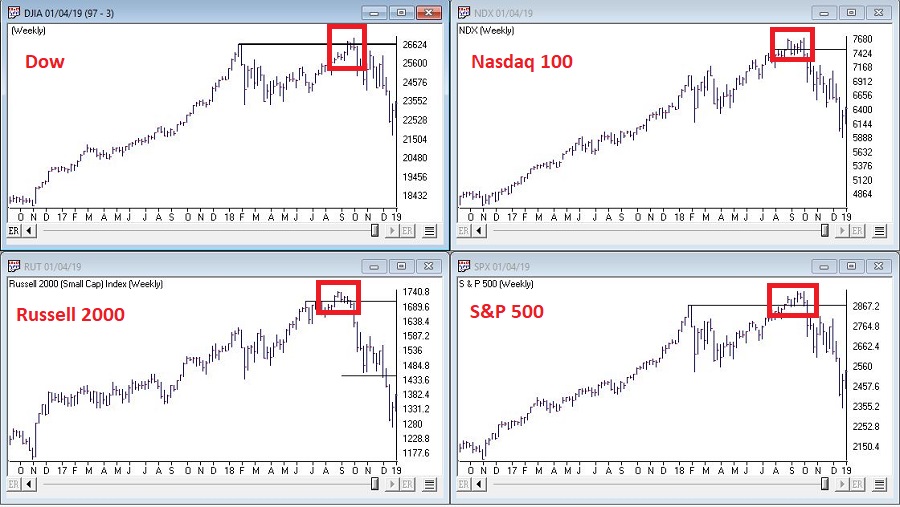
Figure 1 – Four major indexes breakout then fail (Courtesy AIQ TradingExpert)

False breakouts happen all the time.  And the reality here is that sometimes they mean something and sometimes they don’t.  But when all four major average do the same thing, a warning sign has been issued to those who are interested in seeing it.  That’s why it can be useful to seek “confirmation”.  For my purposes I look to what I refer to as my 4 “bellwethers”, which are:

SMH – Semiconductors

TRAN – Dow Transportation Average

ZIV – Velocity Shares Inverse VIX Index

BID – Sotheby Holdings

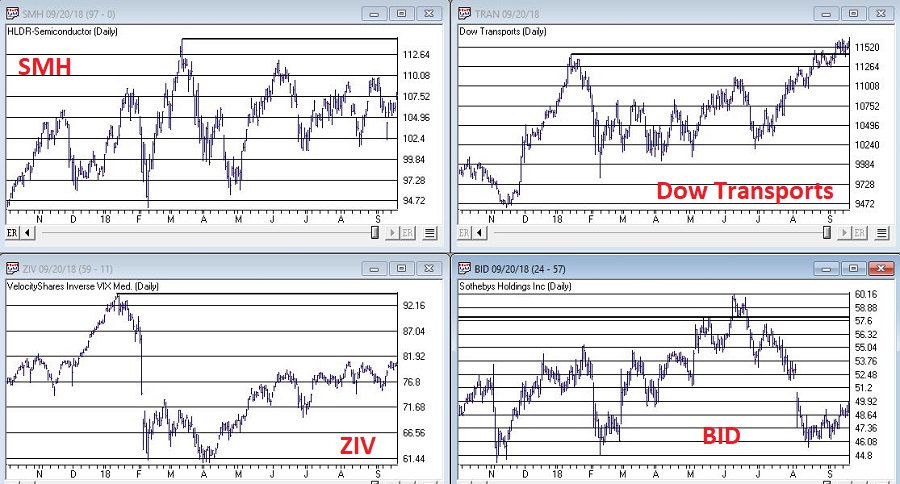
These tickers appear in Figure 2 (click to enlarge).

2

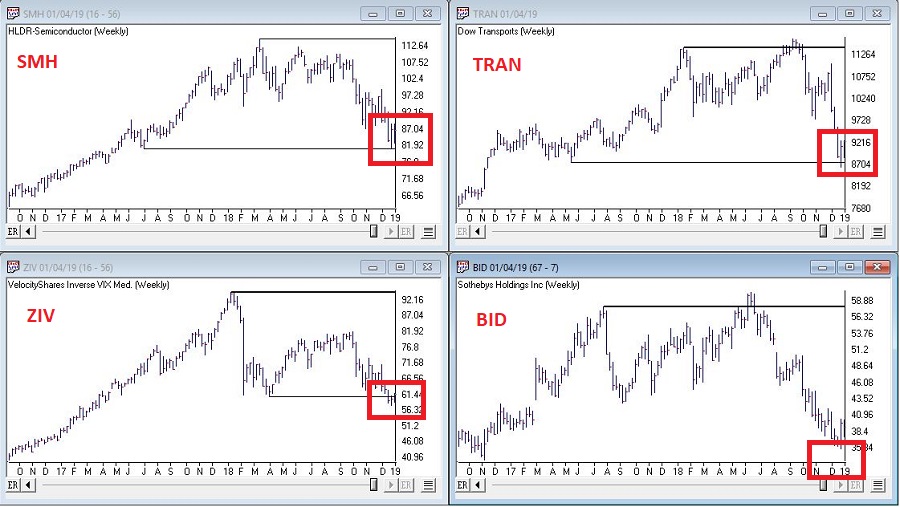
Figure 2 – Jay’s Market Bellwethers (Courtesy AIQ TradingExpert)

While the major indexes were testing new highs in Aug/Sep and then breaking down in October:

SMH – Never really came close to breaking out above its March high

TRAN – Followed the major indexes by hitting new highs in Aug/SP and then breaking down in October

ZIV – Never came anywhere close to its Jan-2018 high

BID – Broke to a new high in Jun/Jul, then failed badly.

In a nutshell, the failed major index breakouts were accompanied by absolutely no positive signs from the 4 bellwethers. So, the warning signs were there if one wished to see them.

So where are the bellwethers now?  Another close look at Figure 2 reveals that:

SMH – the key support level at 80.92

TRAN – the key level for the Dow Transports is 8744.36

ZIV – the key support level is 60.60

BID – a potential support level is 32.95 (the Apr 2013 low)

Summary

*Given the washed-out/oversold level that many indicators and sentiment surveys have reached…

*…Combined with the fact that we are in the seasonally favorable pre-election year (no down pre-election years since the 1930’s)

*There is a chance that 2019 could be surprisingly bullish, and shell-shocked investors should not stick their heads in the sand to the possibility.

At the same time:

*Based solely on trend-following indicators ALL of the major market indexes are technically in confirmed bear markets.  As a result, there is absolutely nothing wrong with having some portion of one’s capital in defensive positions at the moment (30% cash or short-term bonds?).

*Keep a close eye on January performance.  A bullish January would be a positive sign just as a negative January could – in this case – signal a continued market decline.

*Keep a close eye on the 4 Bellwethers relative to their respective support levels.

In a nutshell:

*Up January + Bellwethers holding above support = GOOD

*Down January + Bellwether breaking down below support = BAD

Those are all the “clues” I can offer at the moment.

Jay Kaeppel

Disclaimer:  The data presented herein were obtained from various third-party sources.  While I believe the data to be reliable, no representation is made as to, and no responsibility, warranty or liability is accepted for the accuracy or completeness of such information.  The information, opinions and ideas expressed herein are for informational and educational purposes only and do not constitute and should not be construed as investment advice, an advertisement or offering of investment advisory services, or an offer to sell or a solicitation to buy any security.

NASDAQ dive

Working on some slides for a seminar last week, it was apparent that breadth indicators on the NASDAQ signaled a divergence from the price action of the market.
Looking specifically at AD Ind and HI/LO, although other breadth measures told the same tale.

The AD indicator explained

The Advance/Decline Indicator is an exponentially weighted average of the net advancing versus declining issues. With this indicator, the direction of the trend is of importance and not the actual value of the indicator. When the indicator is increasing, advances are outweighing declines, and when it is decreasing, there are more declining is­sues than advancing.
The  Advance/Decline Indicator is a breadth indicator very similar to the Advance/Decline Line.  However, this indicator tends to be more sensitive and at times will signal a move earlier than the Advance/Decline Line.
The breadth was telling us something was amiss from last week. Take a look at this chart of the NASDAQ clearly a divergence was in place before the downturn.
Today’s (10-10-18) 316 point drop in the NASDAQ a 4% drop and nearly 9% drop from the high is close to the 10% corrective point and some buyers may come in over the next few days and keep the decline in check or not.
The markets are down between 6 and 10% in 5 days. Keeping good stops is a must in your portfolio to protect you from the worst of this. Using trailing stops between 7 and 10 % on stocks that are moving and protective stops 5 to 7 % below initial investment for example can easily reduce your losses in these volatile markets.

New Highs, Check…Now What?

Let’s open with Jay’s Trading Maxim #7.

Jay’s Trading Maxim #7: Being able to identify the trend today is worth more than 1,000 predictions of what the trend will be in the future.

Yes trend-following is boring.  And no, trend-following never does get you in near the bottom nor out at the top.  But the reality is that if you remain long when the trend appears to be up (for our purposes here let’s define this roughly as the majority of major market averages holding above their long-term moving averages) and play defense (i.e., raise cash, hedge, etc.) when the trend appears to be down (i.e., the majority of major market averages are below their long-term moving averages), chances are you will do pretty well for yourself.  And you may find yourself sleeping pretty well at night as well along the way.

To put it more succinctly:

*THE FOREST = Long-term trend

*THE TREES = All the crap that everyone tells you “may” affect the long-term trend at some point in the future

Human nature is a tricky thing.  While we should clearly be focused on THE FOREST the reality is that most investors focus that majority of their attention on all those pesky trees.  Part of the reason for this is that some trees can offer clues.  It’s a question of identifying a few “key trees” and then ignoring the rest of the noise.

A New High

With the Dow Industrials rallying to a new high virtually all the major averages have now reached a new high at least within the last month.  And as you can see in Figure 1 all are well above their respective 200-day moving average.  Long story short the trend is “UP”.

(click to enlarge)1Figure 1 – U.S. Major Market Indexes in Uptrends (Courtesy AIQ TradingExpert)

Now What? The Good News

As strong as the market has been of late it should be noted that we are about to enter the most favorable seasonal portion of the 48-month election cycle.  This period begins at the close of September 2018 and extends through the end of December 2019.

Figure 2 displays the growth of $1,000 invested in the Dow Industrials only during this 15-month period every 4 years.  Figure 3 displays the actual % +(-) for each of these periods.  Note that since 1934-35, the Dow has showed a gain 20 out of 21 times during this period.

2a

Figure 2 – Growth of $1,000 invested in Dow Industrials ONLY during 15 bullish months (mid-term through pre-election year) within 48-month election cycle.

Start Date End Date Dow % +(-)
9/30/1934 12/31/1935 +55.6%
9/30/1938 12/31/1939 +6.2%
9/30/1942 12/31/1943 +24.5%
9/30/1946 12/31/1947 +5.1%
9/30/1950 12/31/1951 +18.9%
9/30/1954 12/31/1955 +35.5%
9/30/1958 12/31/1959 +27.7%
9/30/1962 12/31/1963 +31.8%
9/30/1966 12/31/1967 +16.9%
9/30/1970 12/31/1971 +17.0%
9/30/1974 12/31/1975 +40.2%
9/30/1978 12/31/1979 (-3.1%)
9/30/1982 12/31/1983 +40.4%
9/30/1986 12/31/1987 +9.7%
9/30/1990 12/31/1991 +29.2%
9/30/1994 12/31/1995 +33.1%
9/30/1998 12/31/1999 +46.6%
9/30/2002 12/31/2003 +37.7%
9/30/2006 12/31/2007 +13.6%
9/30/2010 12/31/2011 +13.0%
9/30/2014 12/31/2015 +2.2%

Figure 3 – 15 bullish months (mid-term through pre-election year) within 48-month election cycle

Now What? The Worrisome Trees

While the major averages are setting records a lot of other “things” are not.  My own cluster of “market bellwethers” appear in Figure 4.  Among them the Dow Transportation Index is the only one remotely close to a new high, having broken out to the upside last week.  In the meantime, the semiconductors (ticker SMH), the inverse VIX index ETF (ticker ZIV) and Sotheby’s (ticker BID) continue to meander/flounder. This is by no means a “run for the hills” signal.  But the point is that at some point I would like to see some confirmation from these tickers that often (though obviously not always) presage trouble in the stock market when they fail to confirm bullish action in the major averages.

(click to enlarge)4Figure 4 – Jay’s 4 Bellwethers (SMH/TRAN/ZIV/BID) (Courtesy AIQ TradingExpert)

Another source of potential concern is the action of, well, the rest of the darn World.  Figure 5 displays my own regional indexes – Americas, Europe, Asia/Pacific and Middle East.  They all look awful.

(click to enlarge)3Figure 5 – 4 World Regional Indexes (Courtesy AIQ TradingExpert)

Now the big question is “will the rest of the world’s stock markets start acting better, or will the U.S. market start acting worse?”  Sadly, I can’t answer that question.  The key point I do want to make though is that this dichotomy of performance – i.e., U.S market soaring, rest of the world sinking – is unlikely to be sustainable for very long.

Summary

It is hard to envision the market relentlessly higher with no serious corrections over the next 15 months.  And “yes”, those bellwether and world region indexes trees are “troublesome”.

Still the trend at the moment is inarguably “Up” and we about to enter one of the most seasonally favorable periods for the stock market.

So, my advice is simple:

1) Decide now what defensive actions you will take if the market does start to breakdown

2) Resolve to actually take those actions if the need arises

3) Enjoy the ride as long as it lasts.

Jay Kaeppel

Disclaimer:  The data presented herein were obtained from various third-party sources.  While I believe the data to be reliable, no representation is made as to, and no responsibility, warranty or liability is accepted for the accuracy or completeness of such information.  The information, opinions and ideas expressed herein are for informational and educational purposes only and do not constitute and should not be construed as investment advice, an advertisement or offering of investment advisory services, or an offer to sell or a solicitation to buy any security.

Four Things to Watch for Warning Signs

First things first: I am primarily a trend-follower (this is based on, a) the relative long-term benefits of following trends and b) my lack of ability to actually “predict” anything – but I digress).
As a trend-follower I love the fact that the stock market has been trending higher and the fact that there is so much “angst” regarding the “inevitable top.”  Still, like a lot of investors I try to spot “early warning signs” whenever possible.  Here are the four “things” I am following now for signs of trouble.
Fidelity Select Electronics
In Figure 1 you see, a) the blow-off top of 1999-2000 and b) today.  Are the two the same?  I guess only time will tell.  But the point is, I can’t help but think that if and when the bloom comes off of the electronics boom, overall trouble will follow.  Here is hoping that I am not as correct here as I was here.
1
Figure 1 – Ticker FSELX (Courtesy AIQ TradingExpert)
Just asking.
Transportation Index
As you can see in Figure 2, the Dow Transports has a history of making double tops which is followed by trouble in the broader market.  Are we in the process of building another double top?  And will trouble follow if we are?  Dunno, hence the reason it is on my “Watch List” rather than on my “OH MY GOD SELL EVERYTHING NOW!!!!! List”.
2
Figure 2 – Dow Transportation Index (Courtesy AIQ TradingExpert)
I guess we’ll just have to wait and see.
Ticker XIV
Ticker XIV is an ETF that is designed to track inverse the VIX Index. As a refresher, the VIX Index tends to “spike” higher when stocks fall sharply and to decline when stocks are rising and/or relatively quiet.  To put it in simpler terms, in a bull market ticker XIV will rise.  As you can see in Figure 3 one might argue that XIV has gone “parabolic”.  This is a potential warning sign (assuming you agree that the move is parabolic) as a parabolic price move for just about anything is almost invariably followed by, well, let’s just say, “not so pretty”.
3
Figure 3 – Ticker XIV (Courtesy AIQ TradingExpert)
Let’s hope not.  Because if it does qualify as  parabolic that’s a very bad sign.
Ticker BID
This one may or may not be relevant but for what it is worth, Sotheby’s (ticker BID) has on several occasions served as something of a “leading indicator” at stock market tops (for the record it has also given some false signals, so this one is more for perspective purposes rather than actual trading purposes). Still, if this one tops out in conjunction with any or all of the above, it would likely serve as a useful warning sign.
4
Figure 4 – Ticker BID (Courtesy AIQ TradingExpert)
Summary
There is no “urgent action” to be taken based on any of this.  Bottom line: Nothing in this article should trigger you to run for the exits.
Still, it might be wise to at least take a look around and “locate the exit nearest you.”
You know, just in case.
Chief Market Analyst at JayOnTheMarkets.com and AIQ TradingExpert Pro (Courtesy AIQ TradingExpert) client. http://jayonthemarkets.com/
Disclaimer:  The data presented herein were obtained from various third-party sources.  While I believe the data to be reliable, no representation is made as to, and no responsibility, warranty or liability is accepted for the accuracy or completeness of such information.  The information, opinions and ideas expressed herein are for informational and educational purposes only and do not constitute and should not be construed as investment advice, an advertisement or offering of investment advisory services, or an offer to sell or a solicitation to buy any security.

Volume-Weighted Moving Average Breakouts

The AIQ code based on Ken Calhoun’s article in the February 2017 issue of Technical Analysis ofSTOCKS & COMMODITIES, “Volume-Weighted Moving Average Breakouts,” can be found at http://aiqsystems.com/Volume-Weighted-Moving-Average-Breakouts.EDS 
 
Please note that I tested the author’s system using the NASDAQ 100 list of stocks on daily bars rather than intraday bars from 12/31/2008 thru 2/10/2017. Figure 7 shows the resulting equity curve trading the author’s system with the cross-down exit. Figure 8 shows the ASA report for this test. The annualized return showed about a 17% return with a maximum drawdown of 19%.
Sample Chart

FIGURE 7: AIQ. Here are sample test results from the AIQ Portfolio Manager taking three signals per day and 10 concurrent positions maximum run on NASDAQ 100 stocks (daily bar data) over the period 12/31/08 to 2/10/07.
Sample Chart

FIGURE 8: AIQ. This shows the ASA report for the system, which shows the test metrics and settings.
The code and EDS file can be downloaded from http://aiqsystems.com/Volume-Weighted-Moving-Average-Breakouts.EDS , and is also shown below.
!Volume-Weighted Moving Average Breakouts
!Author: Ken Calhoun, TASC Apr 2017
!Coded by: Richard Denning 2/11/17
!www.TradersEdgeSystems.com

!INPUTS:
smaLen is 70.
vwmaLen is 50.

SMA is simpleavg([close],smaLen).
VWMA is sum([close]*[volume],vwmaLen)/sum([volume],vwmaLen).
HasData if hasdatafor(max(smaLen,vwmaLen)+10)>max(smaLen,vwmaLen).
Buy if SMA < VWMA and valrule(SMA > VWMA,1) and HasData.
Sell if SMA > VWMA.

rsVWMA is VWMA / valresult(VWMA,vwmaLen)-1.
rsSMA is SMA / valresult(SMA,smaLen)-1.
—Richard Denning
info@TradersEdgeSystems.com
for AIQ Systems