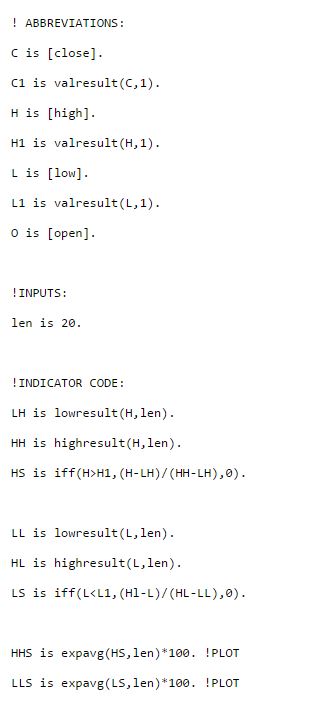
The AIQ code based on Vitali Apirine’s article in February issue of Stocks and Commodities, “Higher Highs and Lower Lows,” is shown here.
The code provided computes the indicator values for the HHS and LLS indicators as well as allowing us to plot the indicator on a chart.
Figure 8 shows the indicator on a chart of Align Technology (ALGN).

FIGURE 8: AIQ. Here, the HHS and LLS indicators are shown on a chart of ALGN.
EDS code is shown below.
!HIGHER HIGHS AND LOWER LOWS

!Author: Vitali Aprine, TASC Feb 2016

!Coded by: Richard Denning, 12/09/2015

!TradersEdgeSystems.com