Let’s open with Jay’s Trading Maxim #7.
Jay’s Trading Maxim #7: Being able to identify the trend today is worth more than 1,000 predictions of what the trend will be in the future.
Yes trend-following is boring. And no, trend-following never does get you in near the bottom nor out at the top. But the reality is that if you remain long when the trend appears to be up (for our purposes here let’s define this roughly as the majority of major market averages holding above their long-term moving averages) and play defense (i.e., raise cash, hedge, etc.) when the trend appears to be down (i.e., the majority of major market averages are below their long-term moving averages), chances are you will do pretty well for yourself. And you may find yourself sleeping pretty well at night as well along the way.
To put it more succinctly:
*THE FOREST = Long-term trend
*THE TREES = All the crap that everyone tells you “may” affect the long-term trend at some point in the future
Human nature is a tricky thing. While we should clearly be focused on THE FOREST the reality is that most investors focus that majority of their attention on all those pesky trees. Part of the reason for this is that some trees can offer clues. It’s a question of identifying a few “key trees” and then ignoring the rest of the noise.
A New High
With the Dow Industrials rallying to a new high virtually all the major averages have now reached a new high at least within the last month. And as you can see in Figure 1 all are well above their respective 200-day moving average. Long story short the trend is “UP”.
(click to enlarge)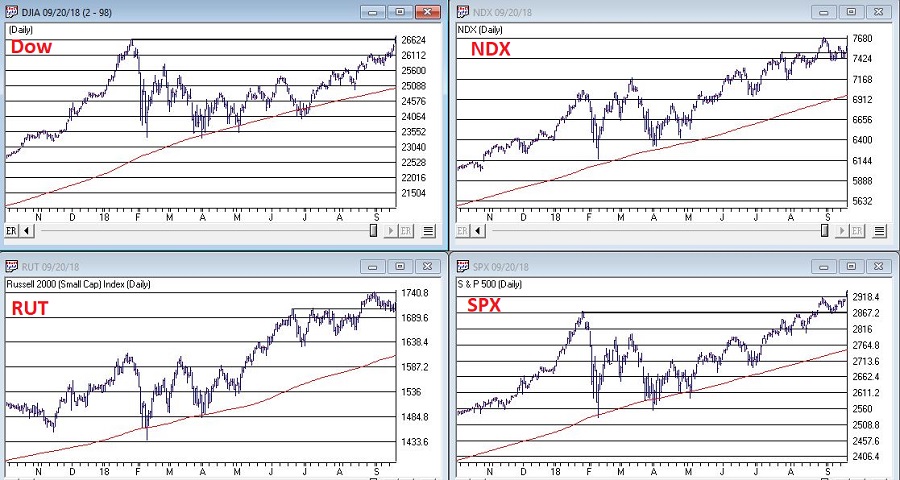 Figure 1 – U.S. Major Market Indexes in Uptrends (Courtesy AIQ TradingExpert)
Now What? The Good News
As strong as the market has been of late it should be noted that we are about to enter the most favorable seasonal portion of the 48-month election cycle. This period begins at the close of September 2018 and extends through the end of December 2019.
Figure 2 displays the growth of $1,000 invested in the Dow Industrials only during this 15-month period every 4 years. Figure 3 displays the actual % +(-) for each of these periods. Note that since 1934-35, the Dow has showed a gain 20 out of 21 times during this period.
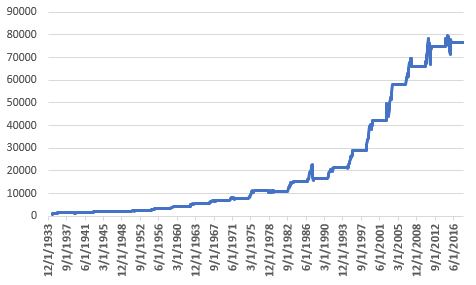
Figure 2 – Growth of $1,000 invested in Dow Industrials ONLY during 15 bullish months (mid-term through pre-election year) within 48-month election cycle.
| Start Date | End Date | Dow % +(-) |
| 9/30/1934 | 12/31/1935 | +55.6% |
| 9/30/1938 | 12/31/1939 | +6.2% |
| 9/30/1942 | 12/31/1943 | +24.5% |
| 9/30/1946 | 12/31/1947 | +5.1% |
| 9/30/1950 | 12/31/1951 | +18.9% |
| 9/30/1954 | 12/31/1955 | +35.5% |
| 9/30/1958 | 12/31/1959 | +27.7% |
| 9/30/1962 | 12/31/1963 | +31.8% |
| 9/30/1966 | 12/31/1967 | +16.9% |
| 9/30/1970 | 12/31/1971 | +17.0% |
| 9/30/1974 | 12/31/1975 | +40.2% |
| 9/30/1978 | 12/31/1979 | (-3.1%) |
| 9/30/1982 | 12/31/1983 | +40.4% |
| 9/30/1986 | 12/31/1987 | +9.7% |
| 9/30/1990 | 12/31/1991 | +29.2% |
| 9/30/1994 | 12/31/1995 | +33.1% |
| 9/30/1998 | 12/31/1999 | +46.6% |
| 9/30/2002 | 12/31/2003 | +37.7% |
| 9/30/2006 | 12/31/2007 | +13.6% |
| 9/30/2010 | 12/31/2011 | +13.0% |
| 9/30/2014 | 12/31/2015 | +2.2% |
Figure 3 – 15 bullish months (mid-term through pre-election year) within 48-month election cycle
Now What? The Worrisome Trees
While the major averages are setting records a lot of other “things” are not. My own cluster of “market bellwethers” appear in Figure 4. Among them the Dow Transportation Index is the only one remotely close to a new high, having broken out to the upside last week. In the meantime, the semiconductors (ticker SMH), the inverse VIX index ETF (ticker ZIV) and Sotheby’s (ticker BID) continue to meander/flounder. This is by no means a “run for the hills” signal. But the point is that at some point I would like to see some confirmation from these tickers that often (though obviously not always) presage trouble in the stock market when they fail to confirm bullish action in the major averages.
(click to enlarge)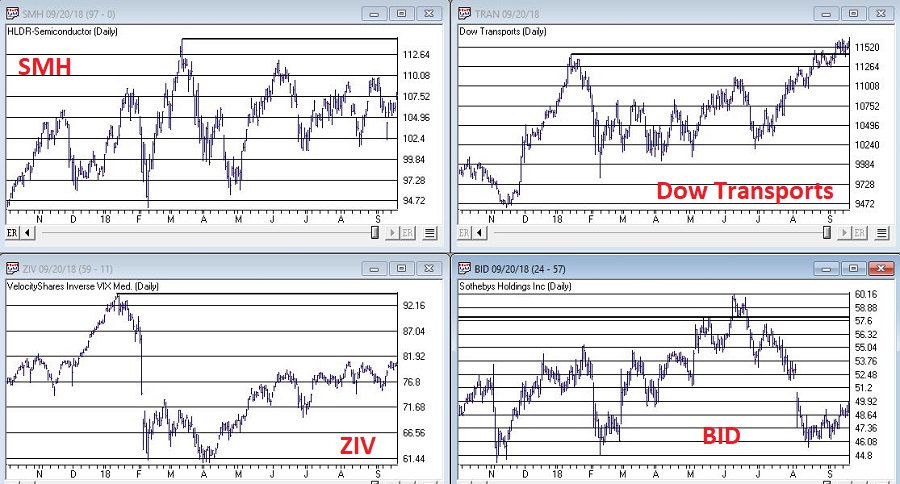 Figure 4 – Jay’s 4 Bellwethers (SMH/TRAN/ZIV/BID) (Courtesy AIQ TradingExpert)
Another source of potential concern is the action of, well, the rest of the darn World. Figure 5 displays my own regional indexes – Americas, Europe, Asia/Pacific and Middle East. They all look awful.
(click to enlarge)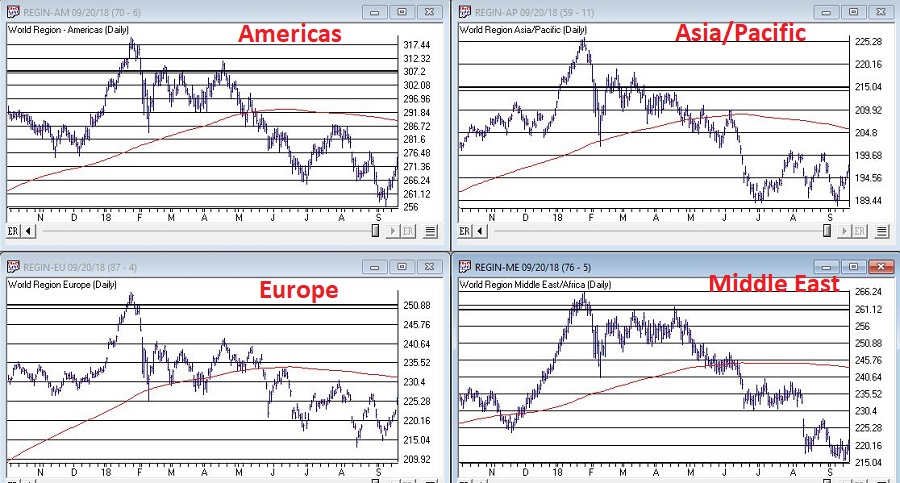 Figure 5 – 4 World Regional Indexes (Courtesy AIQ TradingExpert)
Now the big question is “will the rest of the world’s stock markets start acting better, or will the U.S. market start acting worse?” Sadly, I can’t answer that question. The key point I do want to make though is that this dichotomy of performance – i.e., U.S market soaring, rest of the world sinking – is unlikely to be sustainable for very long.
Summary
It is hard to envision the market relentlessly higher with no serious corrections over the next 15 months. And “yes”, those bellwether and world region indexes trees are “troublesome”.
Still the trend at the moment is inarguably “Up” and we about to enter one of the most seasonally favorable periods for the stock market.
So, my advice is simple:
1) Decide now what defensive actions you will take if the market does start to breakdown
2) Resolve to actually take those actions if the need arises
3) Enjoy the ride as long as it lasts.
Jay Kaeppel
Disclaimer: The data presented herein were obtained from various third-party sources. While I believe the data to be reliable, no representation is made as to, and no responsibility, warranty or liability is accepted for the accuracy or completeness of such information. The information, opinions and ideas expressed herein are for informational and educational purposes only and do not constitute and should not be construed as investment advice, an advertisement or offering of investment advisory services, or an offer to sell or a solicitation to buy any security.