AIQ’s pre-built Relative Strength report offers a valuable tool for those seeking to capitalize on sector rotation. By shifting the focus to ETFS and cloning the report as closely as possible in the AIQ Expert Design Studio, we gain the ability to apply additional screening criteria. This adds a layer of flexibility, that can achieve significant market outperformance. . Through AIQ’s Expert Design Studio (EDS) program, users gain the freedom to create their personalized screening techniques.
The approach we aim for is to utilize an EDS model that seeks out high relative strength. To refresh your memory, the short-term Relative Strength report considers the last 120 trading days, divides this period into quarters, and then calculates the average percent change for each quarter with a heavier weight on the most recent quarter. Here’s the EDS code:
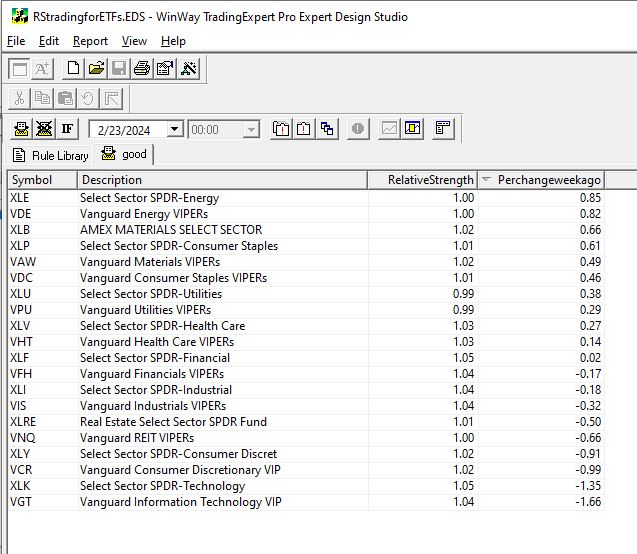
RelativeStrength is 0.4Period1+ 0.2Period2 + 0.2Period3 +0.2Period4. Description is Description().
RSvalue5daysback is valresult(RelativeStrength,5). Perchangeweekago is ((RelativeStrength – RSvalue5daysback)/RSvalue5daysback)*100. ! change is Perchangeweekago. good if 1.
Using this code, an EDS report can be generated to rank ETF sectors from strongest to weakest. While investing in high relative strength sectors can be effective, some individuals might feel uneasy about buying when prices are already high. Often, they regret not entering the market earlier upon seeing a high RS sector.
For those preferring to enter a trend earlier, we can integrate a new screening into our EDS report. We’ve discovered that monitoring the weekly change in RS ranking is valuable for determining whether a sector is gaining or losing momentum.
Relative Strength serves as the primary screening metric, where the objective is to hold positions that appear at the top of the report. Instead of purchasing assets immediately when they top the report, some traders may opt to utilize the Change column to identify sectors with the strongest upward momentum. By selecting sectors with the highest Change numbers, you are essentially investing in sectors exhibiting robust momentum in relative strength.
Traders can easily sort sectors by the Change column by clicking on its title. The benefit of entering sectors with a high Change score is the potential for earlier trend entry. However, the drawback is the possibility of false signals—instances where a trend fails to materialize, causing the sector to stagnate in the relative strength ranking.
Investing in high relative strength sectors or sectors with improving relative strength figures presents a solid strategy for entering industry sectors. These approaches can be combined to create a more dynamic strategy. With the combination strategy, the goal is to identify sectors with both high Relative Strength readings and positive Change readings, indicating strength and ongoing improvement.
In this Chart, we see the top % change ETF from 2/23/24. The recent trend is up and it’s accelerated in the last week.
By employing the combination strategy, the focus typically narrows down to selections at or near the top of the Relative Strength column with positive Change readings. This dual approach ensures a focus on strong sectors and becoming even stronger, optimizing the potential for successful investments.
Market volatility has stabilized some. In this update we’ll take a look at the current AI signals on the Dow Jones. For folks less familiar with our AI engine here’s a recap of what we do.
TradingExpert Pro uses two AI knowledge bases, one specifically designed to issue market timing signals and the other designed to issue stock timing signals.
Each contains approximately 400 rules, but only a few “fire” on any given day. In the language of expert systems, those rules that are found to be valid on a particular day are described as having “fired”.
Rules can fire in opposite directions. When this happens, the bullish and bearish rules fight it out. It’s only when bullish rules dominate that the Expert Rating signal is bullish, or when bearish rules dominate that the Expert Rating signal is bearish.
The Expert Rating consists of two values.
The upside rating is the value on the left and the downside rating is on the right. Expert Ratings are based on a scale of 0 to 100. An Expert Rating of 95 to 100 is considered a strong signal that the Stock or market may change direction.
An Expert Rating below 90 is considered meaningless. A low rating means that there is not enough consistency in the rules that fired to translate to a signal. The expert system has not found enough evidence to warrant a change from the last strong signal.
Market volatility continues. In this update we’ll take a look at the current AI signals on the Dow Jones. For folks less familiar with our AI engine here’s a recap of what we do.
TradingExpert Pro uses two AI knowledge bases, one specifically designed to issue market timing signals and the other designed to issue stock timing signals.
Each contains approximately 400 rules, but only a few “fire” on any given day. In the language of expert systems, those rules that are found to be valid on a particular day are described as having “fired”.
Rules can fire in opposite directions. When this happens, the bullish and bearish rules fight it out. It’s only when bullish rules dominate that the Expert Rating signal is bullish, or when bearish rules dominate that the Expert Rating signal is bearish.
The Expert Rating consists of two values.
The upside rating is the value on the left and the downside rating is on the right. Expert Ratings are based on a scale of 0 to 100. An Expert Rating of 95 to 100 is considered a strong signal that the Stock or market may change direction.
An Expert Rating below 90 is considered meaningless. A low rating means that there is not enough consistency in the rules that fired to translate to a signal. The expert system has not found enough evidence to warrant a change from the last strong signal.
One of the best pieces of advice I ever got was this: “Don’t tell the market what it’s supposed to do, let the market tell you what you’re supposed to do.”
That is profound. And it really makes me wish I could remember the name of the guy who said it. Sorry dude. Anyway, whoever and wherever you are, thank you Sir.
Think about it for a moment. Consider all the “forecasts”, “predictions” and “guides” to “what is next for the stock market” that you have heard during the time that you’ve followed the financial markets. Now consider how many of those actually turned out to be correct. Chances are the percentage is fairly low.
So how do you “let the market tell you what to do?” Well, like everything else, there are lots of different ways to do it. Let’s consider a small sampling.
Basic Trend-Following
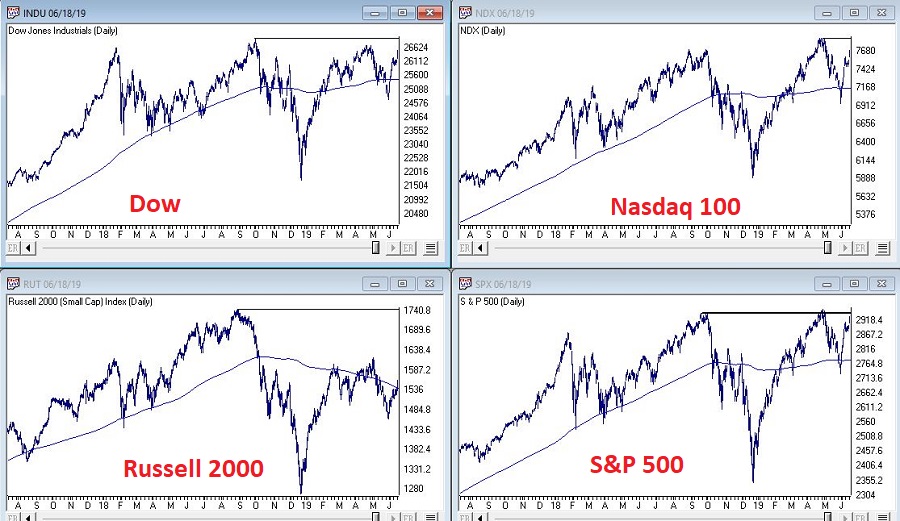
Figure 1 displays the Dow Industrials, the Nasdaq 100, the S&P 500 and the Russell 2000 clockwise form the upper left. Each displays a 200-day moving average and an overhead resistance point.
The goal is to move back above the resistance points and extend the bull market. But the real key is for them to remain in an “uptrend”, i.e.,:
*Price above 200-day MA = GOOD
*Price below 200-day MA = BAD
Here is the tricky part. As you can see, a simple cross of the 200-day moving average for any index may or may not be a harbinger of trouble. That is, there is nothing “magic” about any moving average. In a perfect world we would state that: “A warning sign occurs when the majority of indexes drop below their respective 200-day moving average.”
Yet in both October 2018 and May 2019 all four indexes dropped below their MA’s and still the world did not fall apart, and we did not plunge into a major bear market. And as we sit, all four indexes are now back above their MA’s. So, what’s the moral of the story? Simple – two things:
The fact remains that major bear markets (i.e., the 1 to 3 year -30% or more variety) unfold with all the major averages below their 200-day moving averages. So, it is important to continue to pay attention.
Whipsaws are a fact of life when it comes to moving averages.
The problem then is that #2 causes a lot of investors to forget or simply dismiss #1.
Here is my advice: Don’t be one of those people. While a drop below a specific moving average by most or all the indexes may not mean “SELL EVERYTHING” now, it will ultimately mean “SEEK SHELTER” eventually as the next major bear market unfolds. That is not a “prediction”, that is simply math.
The Bellwethers
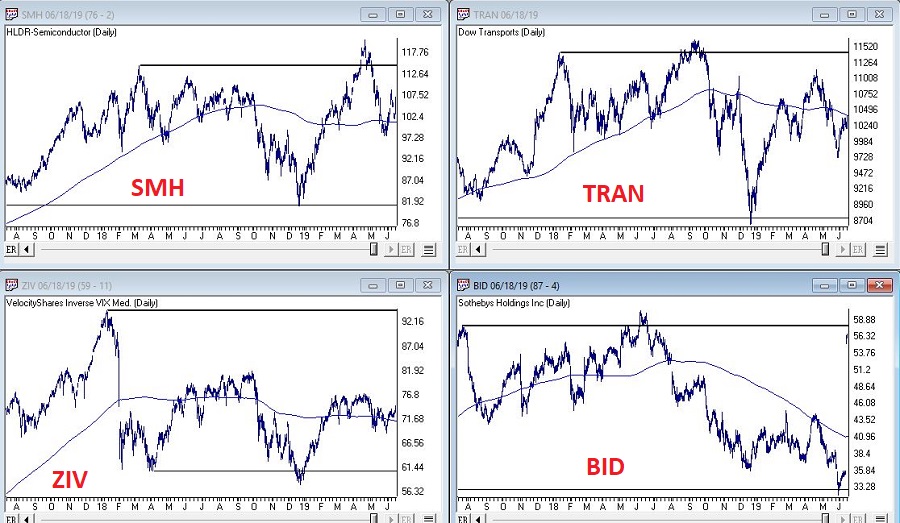
I have written in the past about several tickers that I like to track for “clues” about the overall market. Once again, nothing “magic” about these tickers, but they do have a history of topping out before the major averages prior to bear markets. So, what are they saying? See Figure 2.
SMH (semiconductor ETF): Experienced a false breakout to new highs in April, then plunged. Typically, not a good sign, but it has stabilized for now and is now back above its 200-day MA.
Dow Transports: On a “classic” technical analysis basis, this is an “ugly chart.” Major overhead resistance, not even an attempt to test that resistance since the top last September and price currently below the 200-day MA.
ZIV (inverse VIX ETF): Well below it’s all-time high (albeit well above its key support level), slightly above it’s 200-day MA and sort of seems to be trapped in a range. Doesn’t necessarily scream “SELL”, but the point is it is not suggesting bullish things for the market at the moment.
BID (Sotheby’s – which holds high-end auctions): Just ugly until a buyout offer just appeared. Looks like this bellwether will be going away.
No one should take any action based solely on the action of these bellwethers. But the main thing to note is that these “key” (at least in my market-addled mind) things is that they are intended to be a “look behind the curtain”:
*If the bellwethers are exuding strength overall = GOOD
*If the bellwethers are not exuding strength overall = BAD (or at least not “GOOD”)
A Longer-Term Trend-Following Method
In this article I detailed a longer-term trend-following method that was inspired by an article written by famed investor and Forbes columnist Ken Fisher. The gist is that a top is not formed until the S&P 500 Index goes three calendar months without making a new high. It made a new high in May, so the earliest this method could trigger an “alert” would be the end of August (assuming the S&P 500 Index does NOT trade above it’s May high in the interim.
Jay Kaeppel
Disclaimer: The data presented herein were obtained from various third-party sources. While I believe the data to be reliable, no representation is made as to, and no responsibility, warranty or liability is accepted for the accuracy or completeness of such information. The information, opinions and ideas expressed herein are for informational and educational purposes only and do not constitute and should not be construed as investment advice, an advertisement or offering of investment advisory services, or an offer to sell or a solicitation to buy any security.
The major stock indexes fell about 5% in May and rebounded most of the loss in June so far in one week. Source: CNBC.com
CURRENT EVENTS INFLUENCING MARKET MOVEMENT:
Stocks fell because of the Chinese and the 5% Mexican tariff announcement. There will probably be a positive announcement on the Mexican tariff front as tariffs will hurt our economy and the auto industry. In a positive development, Fed officials said they would be open to reducing interest rates if the tariffs weaken the economy. The current interest rate on the ten-year bond has dropped from 3.2% on the ten-year bond to about 2.10% now just in roughly six months. The affordability of buying a new house has gotten much better.
Trump will do what he can to shore up the economy, and if the markets fall, he is keenly aware of stemming any significant decline in the stock market as he wants to be reelected. The jobs report was a little weaker than was expected; that is why the Fed may reduce interest rates to keep the economy on an upward trajectory consistent with a 2-3% per year growth in the GDP. Overall, I am still positive on the economy unless full tariffs are enacted on the Mexican and the Chinese economies.
If they are expanded to the 25% fully enacted, I will be getting more cautious on the economy and the stock markets.
INTEREST RATE SCENARIO
The Federal funds rate is about 50 basis points or half of 1% higher than the two and five year Treasury Notes and has historically indicated that a recession is looming. The next few months will indicate whether the economy will soften. At this point, I don’t think it will decline as much as to go into recession, but there are still risks. Trump will determine what will happen to the economy. If the tariff situation is resolved, then I think the economy will still be in a growth phase, but if the tariffs are not resolved and get worse, the risks of a recession will increase dramatically.
MARKET RECAP:
Last month on my May 5th Bartometer I said that if the S&P 500 closes below 2,886 I will get VERY CAUTIOUS and It did. After that, it proceeded to 2,740 a drop OF 5%, AND my computer models gave a BUY signal ON 6/5/19, the big up day at 2,800, and it rallied to an intraday high of 2,885.85 and closed at 2875. Even though we are on the BUY-HOLD signal, I would like the S&P 500 to break out of 2886, preferably the 2,893 level and stay there for 2 to 3 days for me to believe the rally can approach the old highs of 2,954. See the charts for an explanation.
Index Averages
Some of the INDEXES of the markets both equities and interest rates are below. The source is Morningstar.com up until June 7, 2019.
*Dow Jones +12.50% S&P 500 +15.60% NASDAQ Aggressive growth +17.50% I Shares Russell 2000 ETF (IWM) Small cap +12.97% International Index (MSCI – EAFE ex USA) +9.97% Moderate Mutual Fund +8.20% Investment Grade Bonds (AAA) +7.03% +2.64% High Yield Merrill Lynch High Yield Index +7.39% +4.26% Floating Rate Bond Index +4.90% +2.60% Fixed Bond Yields (10 year) +2.10% Yield 2.63%
The average Moderate Fund is up 8.2% this year fully invested as a 60% in stocks and 40% in bonds.
If interest rates are peaking and look to be flattening or declining over the next year then investment grade or multisector bonds technically might be better than floating rate bonds. But diversification is important.
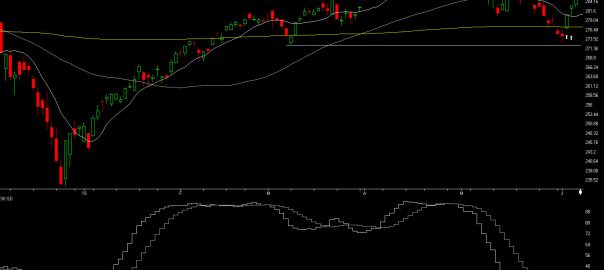
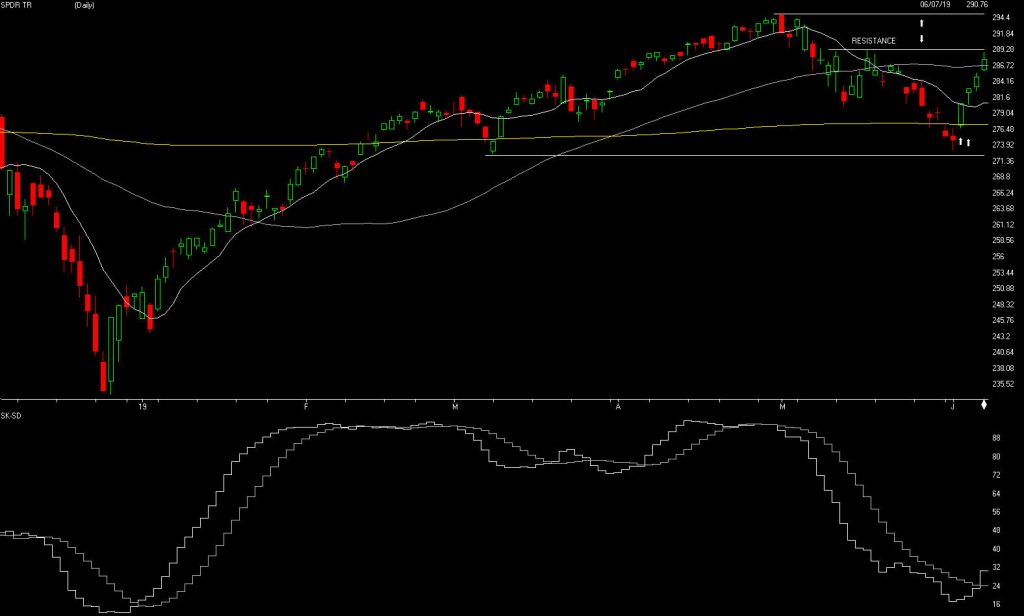
The S&P 500
Source: AIQ Systems
The S&P is above. Last month AIQ gave a SELL signal on April 18th but I went to a VERY CAUTIOUS the close below 2,886. The S&P dropped 5% after it closed below 2,886.
My models went to a BUY signal at 2,800 on 6/05/2019 the S&P now we are right back up to 2,875. Where do we go from here? If the 2,893 level can be broken on the Upside which I think it can and stay there for 2-3 days , then the S&P should approach its old high of 2,954 it hit on May 1, 2019. Notice the graph below the S&P. This chart is the SK-SD stochastics, it is breaking out on the upside and it shows the market is oversold and could continue to rally.
Source: Investopedia
*A Support or support level is the level at which buyers tend to purchase or into a stock or index. It refers to the stock share price that a company or index should hold and start to rise. When a price of the stock falls towards its support level, the support level holds and is confirmed, or the stock continues to decline, and the support level must change.
Support levels on the S&P 500 area are 2865, 2811, 2740, and 2683 areas. These might be BUY areas.
Support levels on the NASDAQ are 7704, 7414, 7291, and 7171.
On the Dow Jones support is at 25,943, 25739, 25,538 and 25,376. These may be safer areas to get into the equity markets on support levels slowly.
RESISTANCE LEVEL ON THE S&P 500 IS 2885. If there is a favorable tariff settlement, the market should rise short term.
THE BOTTOM LINE:
The S&P 500 is right at the point where it needs to break out of 2,893. I am still Moderately Bullish on the market and think it will break out. My computer technical models are on a short term buy signal, so do I think the S&P will breakout above 2,954, the old high it hit on May 1, 2019? We will see, but if it approaches that level, it will be imperative to watch the 2,954 level to see if it turns down. I will be watching that level to see if it is a breakout. If it cannot, then I would become Cautious again.
Best to all of you,
Joe Bartosiewicz, CFP® Investment Advisor Representative
5 Colby Way Avon, CT 06001 860-940-7020 or 860-404-0408
Contact information: SECURITIES AND ADVISORY SERVICES OFFERED THROUGH SAGE POINT FINANCIAL INC., MEMBER FINRA/SIPC, AND SEC-REGISTERED INVESTMENT ADVISOR.
Charts provided by AIQ Systems:
Technical Analysis is based on a study of historical price movements and past trend patterns. There is no assurance that these market changes or trends can or will be duplicated shortly. It logically follows that historical precedent does not guarantee future results. Conclusions expressed in the Technical Analysis section are personal opinions: and may not be construed as recommendations to buy or sell anything.
Disclaimer: The views expressed are not necessarily the view of Sage Point Financial, Inc. and should not be interpreted directly or indirectly as an offer to buy or sell any securities mentioned herein. Securities and Advisory services offered through Sage Point Financial Inc., Member FINRA/SIPC, and SEC-registered investment advisor. Past performance cannot guarantee future results. Investing involves risk, including the potential loss of principal. No investment strategy can guarantee a profit or protect against loss in periods of declining values. Please note that individual situations can vary. Therefore, the information presented in this letter should only be relied upon when coordinated with individual professional advice. *There is no guarantee that a diversified portfolio will outperform a non-diversified portfolio in any given market environment. No investment strategy, such as asset allocation, can guarantee a profit or protect against loss in periods of declining values. It is our goal to help investors by identifying changing market conditions. However, investors should be aware that no investment advisor can accurately predict all of the changes that may occur in the market. The price of commodities is subject to substantial price fluctuations of short periods and may be affected by unpredictable international monetary and political policies. The market for commodities is widely unregulated, and concentrated investing may lead to Sector investing may involve a greater degree of risk than investments with broader diversification. Indexes cannot be invested indirectly, are unmanaged, and do not incur management fees, costs, and expenses. Dow Jones Industrial Average: A weighted price average of 30 significant stocks traded on the New York Stock Exchange and the NASDAQ. S&P 500: The S&P 500 is an unmanaged indexed comprised of 500 widely held securities considered to be representative of the stock market in general. NASDAQ: the NASDAQ Composite Index is an unmanaged, market-weighted index of all over the counter common stocks traded on the National Association of Securities Dealers Automated Quotation System (IWM) I Shares Russell 2000 ETF: Which tracks the Russell 2000 index: which measures the performance of the small capitalization sector of the U.S. equity market. A Moderate Mutual Fund risk mutual has approximately 50-70% of its portfolio in different equities, from growth, income stocks, international and emerging markets stocks to 30-50% of its portfolio indifferent categories of bonds and cash. It seeks capital appreciation with a low to moderate level of current income. The Merrill Lynch High Yield Master Index: A broad-based measure of the performance of non-investment grade US Bonds MSCI EAFE: the MSCI EAFE Index (Morgan Stanley Capital International Europe, Australia, and Far East Index) is a widely recognized benchmark of non-US markets. It is an unmanaged index composed of a sample of companies’ representative of the market structure of 20 European and Pacific Basin countries and includes reinvestment of all dividends. Investment grade bond index: The S&P 500 Investment-grade corporate bond index, a sub-index of the S&P 500 Bond Index, seeks to measure the performance of the US corporate debt issued by constituents in the S&P 500 with an investment grade rating. The S&P 500 Bond index is designed to be a corporate-bond counterpart to the S&P 500, which is widely regarded as the best single gauge of large cap US equities. Floating Rate Bond Index is a rule-based, market-value weighted index engineered to measure the performance and characteristics of floating rate coupon U.S. Treasuries which have a maturity greater than 12 months.