August 18, 2019
Hello Everyone,
Over the last month the S&P 500 has fallen 4.1%, and 2.2% from my VERY CAUTIOUS SIGNAL of the 2954 break. Even though the markets are down for the month, they are still up nicely for the year. Bonds have rallied as well as commodities such as gold and silver.
Last month I stated that there was a Bearish pattern emerging called a Rising Wedge and I talked about the negative break of the pattern and once it closed below that pattern I went negative. You can clearly see the pattern on the chart below. Now that it has broken to the downside what happens
now?
We are not fortune tellers on what Trump will say or tweet, we don’t know what the Chinese will say or how they will react, but the technicals are not that bad and are starting to get a little more positive. My computer models are currently at a short term BUY signal, but things change daily like the tweets.
You have heard that because of the inverted yield curve, where typical money market is yielding 2% and the 10 year bond is yielding 1.6%. You can see that it is inverted. The 10 year bond should be yielding above the daily money market, not below it. Because of this and the inversion of most of the bonds, there might be a recession in about 1 to 1.5 years. I have been saying that over my last many Bartometers that I see a recession in about a year and a half, but not yet. What may be causing the inversion, may be foreign countries that have a negative yield actually buying our 2 to 30 year bonds and pushing the price up and the driving the yields down.
My fundamental economist Dr. Robert Genetski, from classicalPrinciples.com believes that while most observers believe that trade barriers are the main headwind facing stocks, like the Chinese tariffs, he is more concerned over a restrictive monetary policy. Signs of monetary restraint from interest rates and liquidity suggest that the odds of a recession have increased.
The S&P 500 is now 10% below his estimate of its value. As such, a positive announcement on trade or money can quickly send stocks soaring. For the moment the Fed will resist easing policy.
However, if stocks and interest rates continue to decline, constant pressure from the President to ease policy will lead to an abrupt, positive change. Such a change would quickly allow a resumption of the bull market in stocks.
On the Technical Side
My computer models went on a very short BUY signal last week, but there are three resistance and 2 support levels you may want to remember, 2944 is the first level where the S&P may stall and 2954.71 is the next major level that if broken and it I closes above that level many traders may come in and start buying possibly pushing the markets up and testing the old highs of 3025.
On the other hand, on the downside 2823 has buying support and 2799 is the 200 day moving average. That may hold too. It is now trading in a channel, 2944 on the top and 2823 on the bottom. A close of either one of those areas could mean the next major up or down trend direction.
Interest Outlook
I see the Federal Reserve reducing interest rates ¼% in December.
Index Averages
Some of the INDEXES of the markets both equities and interest rates are below. The source is Morningstar.com up until August 16th, 2019. These are passive indexes.
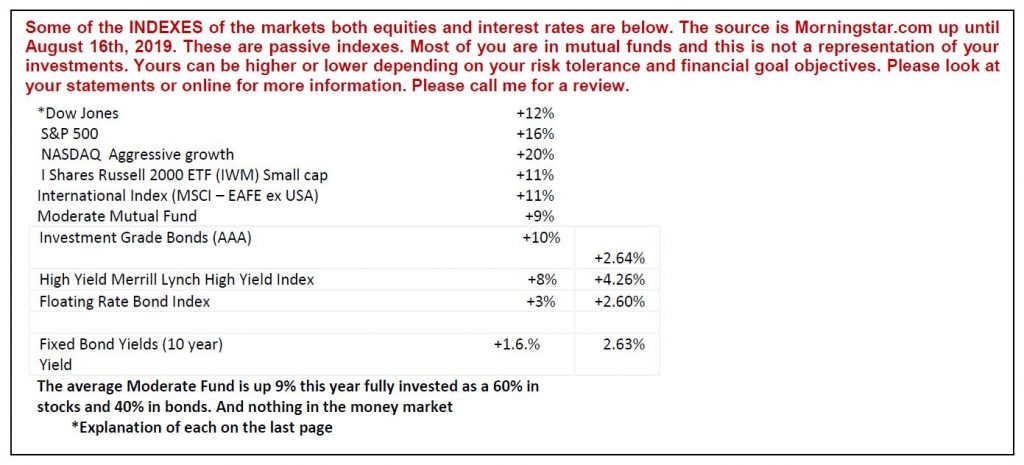
*Explanation of each on the last page
The S&P 500
Rising Wedge
Support
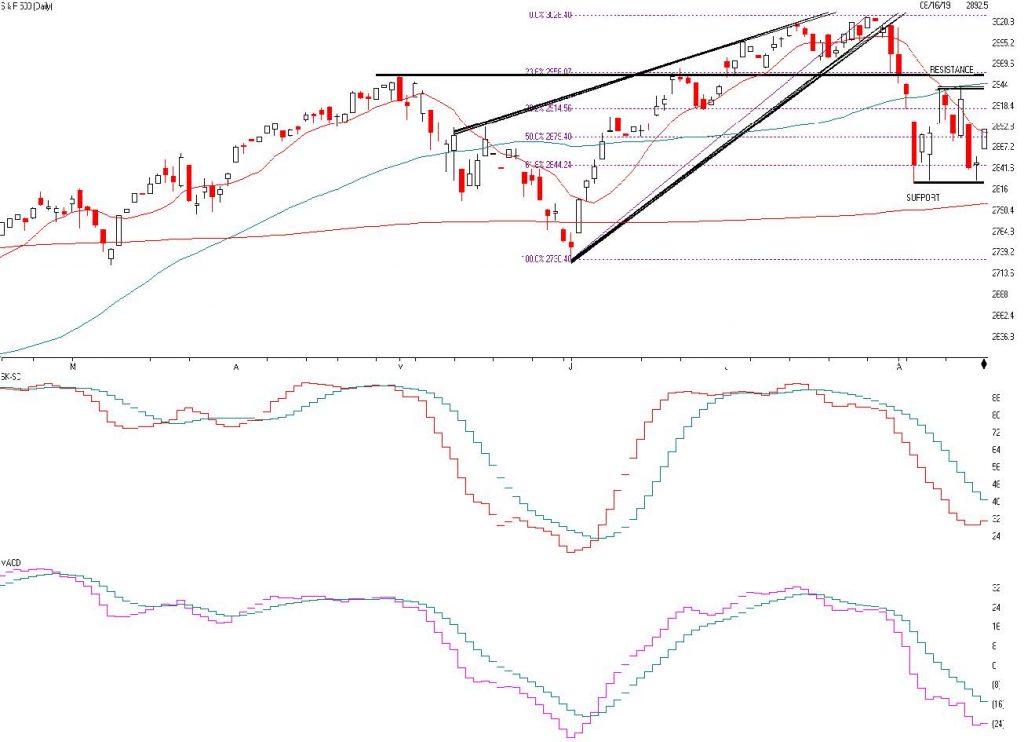
The S&P 500 is above. Last month I stated that there was a Rising Wedge Pattern that was technically bearish and that a break below the bottom of the pattern would make me Very Cautious. Now that it has broken below that pattern it is trading between 2823 and 2944. If the S&P closes above 2944 it could push it to 2954 where it could find heavier resistance. If it stays above 2954 for 2 to 3 days with heavy volume the market may have turned to a Bullish stance, but Volatility will remain. Even though we went to a SHORT TERM BUY signal, I am still a little Cautious.
The 2nd and third chart show the SK-SD Stochastics. At 32-40 where the arrow is pointing shows that the market is getting oversold and getting cheap and ready for a bounce. The third graph shows that the market momentum is still negative as the pink line is below the green line. A Short term Buy signal would be generated when the pink line crosses over the green line showing that momentum is again on the bullish side. As of right now the market technicals are getting better and a close above 2954.71 could change the trend to the positive side. Support levels on the S&P where
there may be buying support is 2823, 2727 the 200 moving average, and 2730 the test and the low of the June low. I like the USA markets more than the International markets.
Source: AIQ Systems on graphs
The rising wedge pattern is characterized by a chart pattern which forms when the market makes higher highs and higher lows with a contracting range. When this pattern is found in an uptrend, it is considered a reversal pattern, as the contraction of the range indicates that the uptrend is losing strength. When this pattern is found in a downtrend, it is considered a bearish pattern, as the market range becomes narrower into the correction, indicating that the correction is losing strength, and that the resumption of the downtrend is in the making.
In a rising wedge, both boundary lines slant up from left to right. Although both lines point in the same direction, the lower line rises at a steeper angle than the upper one. Prices usually decline after breaking through the lower boundary line. As far as volumes are concerned, they keep on declining with each new price advance or wave up, indicating that the demand is weakening at the higher price level. A rising wedge is more reliable when found in a bearish market. In a bullish trend what seems to be a Rising Wedge may actually be a Flag or a Pennant (stepbrother of a wedge) requiring about 4 weeks to complete
Rising Wedges are not guaranteed so the 3019-3022 level and staying there for a couple of days could void this negative pattern. A break decisively on a close below 2979 could satisfy the Rising Wedge.
Source: Investopedia
*A Support or support level is the level at which buyers tend to purchase or into a stock or index. It refers to the stock share price that a company or index should hold and start to rise. When a price of the stock falls towards its support level, the support level holds and is confirmed, or the stock continues to decline, and the support level must change.
▪ Support levels on the S&P 500 area are 2844, 2803, and 2730. These might be BUY areas.
▪ Support levels on the NASDAQ are 7862, 7657, 7416, and 7291.
▪ On the Dow Jones support is at 25,376, 25,213, and 24,686. These may be safer areas to get into the equity markets on support levels slowly.
▪ RESISTANCE LEVEL ON THE S&P 500 IS 2944, 2954.71 and 302 . If there is a favorable tariff settlement, the market should rise short term.
THE BOTTOM LINE:
The S&P 500 is currently about 2.2% below my Very Cautious signal of 2954. The market should be volatile especially with seasonal patterns of August through the end of October being seasonally weak. With the inverted yield curve and hints of recession over the next 1.5 years investors should be somewhat cautious over the shorter term unless the S&P 500 closes above 2944 and more if it closes about 2954.71 and stays there for a couple of days with heavy volume. It looks like the market wants to goes up but with tweets coming out hourly, market timing will be more difficult. If things come in as Trump expects, watch for a solid rally possibly to the old highs. But there are headwinds currently short term.
Best to all of you,
Joe
Joe Bartosiewicz, CFP®
5 Colby Way
Avon, CT 06001
860-940-7020 or 860-404-0408
Investment Advisor Representative
SECURITIES AND ADVISORY SERVICES OFFERED THROUGH SAGE POINT FINANCIAL INC., MEMBER FINRA/SIPC, AND SEC-REGISTERED INVESTMENT ADVISOR.
Charts provided by AIQ Systems:
Technical Analysis is based on a study of historical price movements and past trend patterns. There is no assurance that these market changes or trends can or will be duplicated shortly. It logically follows that historical precedent does not guarantee future results. Conclusions expressed in the Technical Analysis section are personal opinions: and may not be construed as recommendations to buy or sell anything.
Disclaimer: The views expressed are not necessarily the view of Sage Point Financial, Inc. and should not be interpreted directly or indirectly as an offer to buy or sell any securities mentioned herein. Securities and Advisory services offered through Sage Point Financial Inc., Member FINRA/SIPC, and SEC-registered investment advisor.