|
Dear Trader,
For years the
fundamental module in TradingExpert Pro has provided a unique trading
strategy tool for filtering stocks. These include
·
Advanced weighting
the impact of different fundamentals
·
Quick build of
reports and lists
·
Chart list
from fundamental reports
·
Rank and
tag tickers so you’ll always know where they stand
fundamentally
The most popular
use of the fundamental data is in combination with technical strategies
in the Expert Design Studio. What better way to hone in on candidates
than to combine both approaches in one strategy that you can run every
night.
Now with the
launch of the AIQ Data Power Pack FATI®,
you can get updated fundamentals each month directly into your
TradingExpert Pro again.
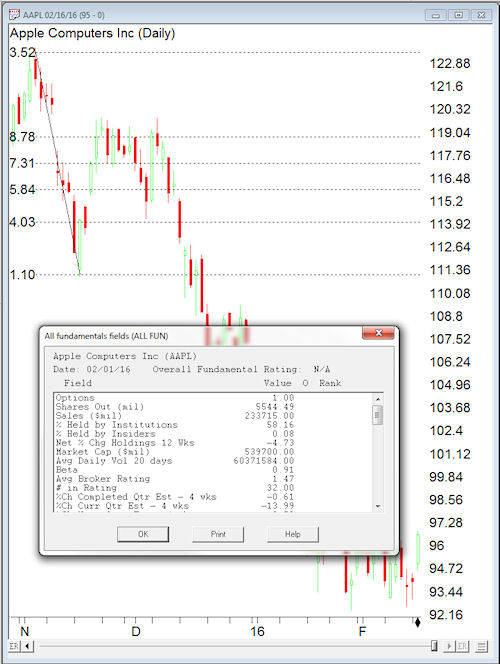
Over 4400 Charts with
instant click to
60 fundamentals fields
Here’s the
entire list of fields available on 4400 stocks, updated each month and available in
AIQ Charts, Fundamentals and Expert Design Studio.
·
Options
·
Shares Outstanding (mil)
·
Sales ($mil)
·
% Held by Institutions
·
% Held by Insiders Net
·
% Chg Holdings 12 Wks Market Cap ($mil)
·
Current Ratio
·
Avg Daily Vol 20 days
·
Beta
·
Avg Broker Rating
·
No. in Rating
·
% Change Completed Qtr Est – 4 wks
·
% Change Curr Qtr Est – 4 wks
·
% Change Next Qtr Est – 4 wks
·
% Change Curr Fiscal Yr Est – 4 wks
·
% Change Next Fiscal Yr Est – 4 wks
·
Est EPS Growth Current Year
·
Est EPS Growth Curr & Next Yr
·
Qtr EPS this Qtr/ prior qtr
·
Qtr EPS last Qtr/ prior qtr
·
Qtr EPS 2Qtrs ago/ prior qtr
·
Anl Sales this Yr/ Sales last Yr
·
2 Years Ahead Sales Growth
·
Cash Flow 5 Yr Avg
·
Div Yield
·
Indicated Anl Div
·
Payout Ratio
·
P/E using Curr FY Est
·
P/E using Next FY Est
·
Return on Equity
·
Return on Assets
·
Return on Investment
·
Inventory Turnover
·
Receivables Turnover
·
Asset Utilization
·
Debt/ Tot Cap
·
Debt/Equity Current Ratio
·
Market Capitalization
·
Quick Ratio
·
Cash Ratio
·
Interest Coverage
·
Cash Flow ($/sh)
·
Price/ Book
·
EV/EBITDA 12 Mo
·
P/E F1/ LT EPS Gr
·
Pretax Mgn 12 Mo
·
Net Mgn 12 Mo
·
Oper Mgn 12 Mo
·
Current Fiscal Yr Cons Est
·
# Anlst in Cons Current Fiscal Yr
·
Next Fiscal Yr Cons Est
·
# Anlst in Cons Next Fiscal Yr
·
Completed Quarter Cons Est
·
# Anlst in Cons Completed Qtr
·
Current Quarter Cons Est
·
# Anlst in Cons Current Qtr
·
Next Quarter Cons Est
·
# Anlst in Cons Next Qtr
·
12 Mo EPS before NRI
·
Piotroski Score
Unleash the power of
fundamental
ranking with any
number of strategies
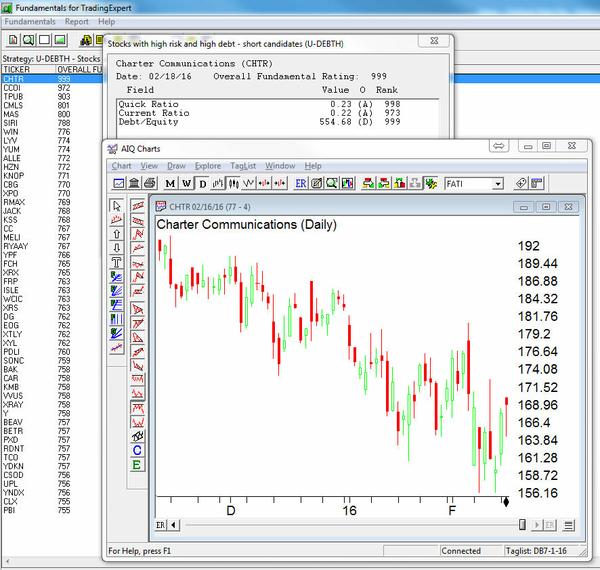
Suppose I want a
list of stocks to short that are fundamentally weak what would I look
for?
How about a High Risk, High Debt
strategy?
This strategy
finds stocks that having hard time meeting their day-to-day
obligations.It finds stocks with the lowest quick and current ratio.
The lower, the more debt and liabilities and the less able a company is
to pay current debt. Add in a high debt to equity ratio and rank them
all equally. You’ll have a list of stocks that are worth keeping an eye
on for a technical entry to the short side.
Here’s Charter
Communications, the top high risk high debt ticker on 2/18/16
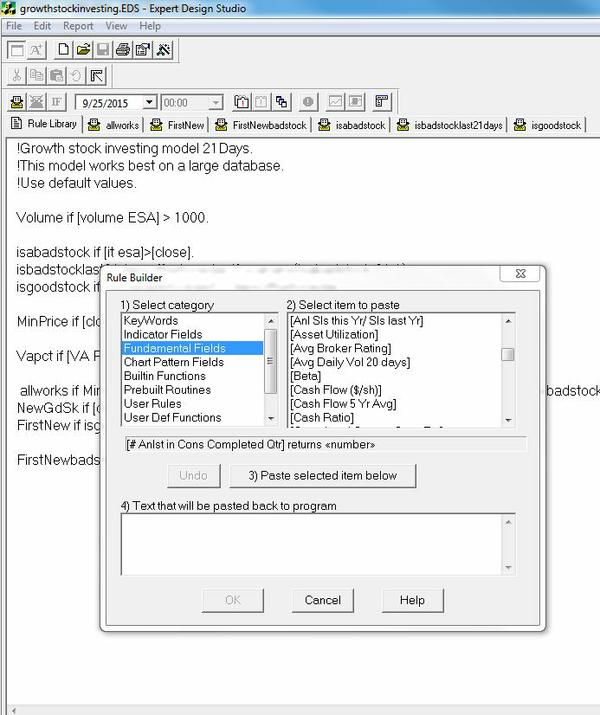
Build
a technical and fundamental strategy in Expert Design Studio
and run it every night
EDS allows you
to design, test, and automate virtually any trading idea with the
point-and-click interactive trading library and pre-built strategies
that have been fine-tuned by our analysts to produce outstanding
results.
With the FATI® fundamentals fields, you can add in another layer of
screening to your technical screening and uncover hidden gems in your
database.
Included
with your fundamentals
FATI® Sector and Group
Structure
Quality and Opportunity is right here. Stocks fitting the
fundamental criteria below are arranged into the FATI® Sector and Group
Structure and provided to you updated each month.
These lists contain stocks which have the following four key
characteristics.
- Average
Daily Trading Volume > 84,999 shares
- Current
Price > $4.99
- Number
of Analysts Ratings >= 2
- Market
Valuation > $99 million
|
FATI® Sector and
Group Structure – There
are approximately 2500-3000 stocks on average. They are broken down
into 17 sectors and over 60 industry groups.
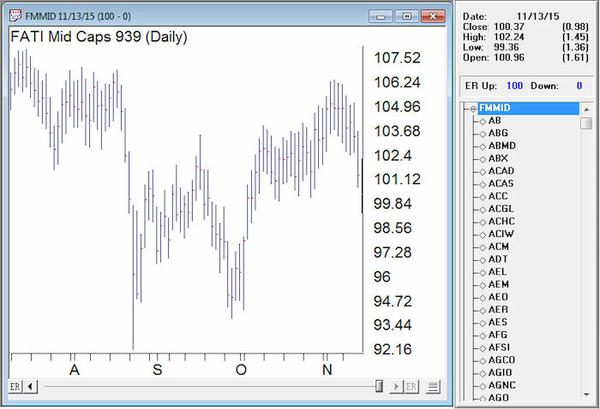
Extra bonus
FATI® Market
Capitalization
The same list of
stocks as in the FATI® Sector & Group list broken down by market
capitalization into separate lists. Make your analysis
segment focused with ease.
- Mega Cap > $50bn
- Large Cap > $10bn < $50bn
- Mid Cap > $2bn < $10bn
- Small > $1bn < $2bn
- Micro > $500mn < $1bn
- Nano >$99mn < $500mn
Updated tickers, lists and fundamental data every
month for one price
$29.99/mo.
or call Sales: (800) 332-2999 1
775-832-2798 from outside the U.S.
|