Technical Support, With a Paper Trail.
Four decades of answers, organized. Search every question below, or browse by topic.
(775) 747-8404
(800) 332-2999 · +1 775-832-2798 intl.
No support topics match that search — try a different term, or email support@aiqsystems.com.
Installation & Getting Started
I don't have my installation instructions — where do I begin?
Start with the installation guide here: Installation information.
The icons on the main menu are gray — how do I activate them?
From the main menu, click Applications → Registration → Yes, and email the registration number to support@aiqsystems.com.
The TradingExpert install download is blocked by my browser on a new Windows 10/11 computer
Some new computers ship with Windows in "S" mode, which only allows installs from the Microsoft Store. To switch out of S mode, follow the instructions at this Microsoft Support link.
Can I install TradingExpert on a Mac?
Yes, but it is not recommended or supported. It requires an emulator like Parallels with Windows 10 or 11 installed. Macs with ARM chips are not supported.
Can I install TradingExpert to a directory different than the default?
Yes, but it is not recommended. (Note: the Data Transfer Utility requires the default Wintes32 location to work correctly — see the DTU tab.)
How do I fix corrupted registration when launching AIQ applications?
Click Start → Run (or type in the Start search box): Regedit
- Double-click Regedit to start the Registry Editor.
- Double-click HKEY_LOCAL_MACHINE.
- Double-click Software.
- Double-click WOW6432Node.
- Double-click AIQ Systems.
- Double-click TradingExpert 32.
- Highlight Registration and press Delete on your keyboard.
Close the Windows Registry, right-click the TradingExpert Pro main menu and choose Run As Administrator. The icons should auto-refresh. To get a new key, click Applications → Registration and email the registration number to support@aiqsystems.com.
If you are not a Dial/Data or IDC/eSignal lease customer, click Applications → Registration and email us the registration number.
How do I add my two sets of credentials (eSignal and DataFeed) into TradingExpert Pro?
When you sign up for eSignal/IDC data service, you receive two different sets of credentials. The first set (eSignal) is for streaming real-time/delayed data and is available right after you activate your service. The second set (DataFeed) follows 3–5 days later and allows you to download end-of-day data to update your locally stored ticker data.
For WinWay TradingExpert Pro the process is identical, except the program resides in a folder group labeled WinWay TradingExpert Pro.
For WinWay TradingExpert End of Day, a separate video explains the process: [ADD LINK — video URL missing from old page]
Charts
How can I make my favorite indicators always appear with every chart I view?
In Charts, choose the indicators you want to see with every chart (use CTRL + left mouse click to choose more than one). Then click Chart → Settings → Save Current Indicators.
Can I add custom indicators?
Yes, but only for historical charts — custom indicators are not available for Real-time Charts. To set one up: click Chart → Settings → Indicator Library → EDS Indicators. Click Add, then choose the EDS file you wish to get the UDF from. Next choose the plot type, give the indicator a description, and choose the UDF you want to plot. Click Done and the indicator will appear at the bottom of the indicator list.
How do I delete trendlines from a chart?
Right-click the trendline and choose Delete, or Delete All.
How do I correct a bad data spike on a historical chart?
Go to Data Retrieval, enter the ticker, choose Reload History, enter the date(s) of the incorrect data, and click Start Update. If corrected data has been received from the data service, the chart will show the changes.
How can I see more years of price history on my historical charts?
When you open an AIQ chart you'll generally see about a year of daily data. To see roughly 5 years, click the Weekly/Daily toggle button on the toolbar. To see 5–10 years, click the Max View (Close Only) button. To further expand the chart, hide the indicator control panel by pressing F10 (F10 toggles the panel off and on).
The vertical line on my chart has disappeared — how do I get it back?
Use the A key on your keyboard to toggle the vertical line to a diamond.
Market Charts
How can I change the symbols that come up when I click the Market icon?
There are two ways:
- From the Main Menu: Settings → Market Indices. Enter each symbol separated by a semicolon (;). No more than 12 symbols can be entered.
- From the Chart window: Chart → Settings → Market Indices. Same format, same 12-symbol limit.
When I click the Market icon I get a GPF — how can I fix this?
This error usually comes from the Point and Figure indicator. To fix it:
- Open a Market chart (for example, DJIA), hold CTRL and click the PTFig indicator to remove the Point and Figure chart.
- Click Chart → Settings → Save Current Indicators.
- Try the Market Charts again.
Data Manager
How do I add ticker symbols to my Master Ticker List?
Click Ticker → New and follow the wizard to add a ticker.
How do I check my data for errors I may have missed?
Use Check Ticker Data in Data Manager → Utilities to identify — and in some cases fix — bad data. Errors are recorded in System Messages; some will require downloading one or more days of data to correct. Check Ticker Data can identify the following issues:
Check Open, High, Low, and Close — looks for Open and Close values not consistent with High and Low values.
Fix Open errors — if Open is greater than High, sets Open to High; if Open is less than Low, sets Open to Low.
Check for days with no prices — looks for days on which tickers have no price data.
Fix days with no prices — zeroes out days with partial prices. If a ticker has a closing price but no high, for example, the entire day is invalid and will be zeroed out (including volume). This remote possibility can occur when a data service sends erroneous data; it's your responsibility to re-download the affected days from your data service.
Check for price variances greater than or equal to — looks for day-to-day price changes greater than the percentage specified (default 25%). You can change this value, and you can specify a ticker price minimum or maximum for the check. For example, to check a 45% variance for tickers priced at or below $5.00, set: Greater Than or Equal to 45%, For Prices <= 5.0000.
Check for zero volume — looks for days on which tickers have no volume.
Check start dates / Fix start dates — compares the actual date of first data against First Date. If the actual first-data date is later, resets First Date (reducing file size). If a ticker's start date falls on a holiday, this changes it to the first non-holiday date after.
Fix Negative Prices or Volume — if negative prices are found, all prices (including volume) for that day are set to zero; if only negative volume is found, only volume is zeroed. Re-download the affected days from your data service.
How do I create a group list?
- In Data Manager, click List → New to create a new list (it appears in the left window).
- Click Ticker → New, enter a sector symbol, and choose Sector as the type. Drag this symbol onto the list name and drop it.
- Click Ticker → New, enter a group symbol, and choose Group as the type. Drag this symbol onto the Sector symbol and drop it.
- Highlight the group symbol in the list on the left. Click Ticker → Insert and enter the stock symbol(s), separating multiples with a semicolon (;).
- Finally, click Utilities → Compute Group/Sector Indices, highlight the list on the left, and click OK.
How does AIQ calculate the groups and sectors?
First day of the index (Close): for each stock, current close ÷ prior close = ratio. Sum of all ratios ÷ number of stocks in the group × the group's prior close (should be 100).
After the first day: sum of all ratios ÷ number of stocks in the group × the group's prior close.
High, low and open (example for high): current high ÷ current close = ratio. Sum of all ratios ÷ number of stocks × the group's current close.
What is an AIQ Market, and how is it different from a regular index?
Regular indices like the Dow Jones (ticker INDU) are available from many sources, which provide the open, high, low, and close for the index itself — with no volume figures for most indices. An AIQ Market is a unique ticker available only in AIQ software: instead of analyzing an index's price action alone, AIQ combines an index price ticker like INDU with the breadth information (advancing/declining issues and volume) from an associated exchange. For example, the AIQ ticker DJIA is a market combining the INDU index with breadth data from the New York Stock Exchange. When you chart DJIA, you see a price chart of INDU with technical indicators that are also volume-based, derived from NYSE breadth data.
What are the different types of lists?
AIQ list files organize tickers into easy-to-use containers available throughout the software. There are distinct types serving different purposes.
Linear (one-level) lists:
Taglist — created in Charts (Taglist → Set Taglist). Lets you add tickers to a list directly while charting. Tickers are organized alphabetically.
Report lists — in Reports, you can place all tickers in a given report into a list (with a report open, click the Build Report List toolbar button). Tickers are organized in report order.
EDS lists — in EDS, create a list of stocks produced by a trading strategy (Chart List toolbar button). Tickers are organized in the order they appear in the EDS report.
Group/Sector (multi-level) lists — linear lists let you scroll back and forth through tickers. Group/Sector lists do that too, but also let you explore up and down: from a ticker to its associated group, and from groups combined into a sector. You can explore up, down, and across the whole structure.
The window that shows my symbols is missing — how do I get it back?
The window has probably been resized. Slowly drag the mouse to the right edge of the Data Manager window; when the pointer changes to a double-headed arrow, left-click and drag back to the right.
One of the groups is showing a bad data spike — how can I correct this?
First, scroll through the group and find the stock with bad data. Use Data Retrieval to reload history on that stock. Then, in Data Manager, click Utilities → Compute Group/Sector Indices, highlight the group symbol, and click Recompute All Dates.
Data Retrieval
Will splits and distributions be automatically calculated?
Yes. In Data Retrieval Options, check "Process Splits and Dividends" and "Process Distributions." When the data service sends the information, the program will automatically adjust the pricing.
What time should the update be performed?
Wait until 8:30pm ET before updating your database.
The connection log says "communication complete, no requests made" — what does this mean?
This could mean your computer's date or time is incorrect.
I have bad data on one of my stocks — how do I correct it?
In Data Retrieval Options, click Selected Ticker and enter the symbol. Click Reload History, enter the dates of the bad data, and click Start Update. Once processed, the bad data should be overwritten with corrected data.
I keep getting "limit exceeded" when updating and data will not update — how do I fix it?
Open Data Manager, click Utilities, and choose Delete Non-Trading Stocks.
The program GPFs in AIQcom32.exe when processing data — how can this be fixed?
Open Data Manager, click Utilities, and choose Rebuild Master Ticker List.
I receive "unable to connect to Dial/Data"
Dial/Data uses Port 23, and some routers/firewalls block this port. You'll need to allow your router/firewall to use this port.
Connection Failed: ETIMEOUT / RAS Offline
If you've enabled a Secure VPN feature through your security software or router, it may block Data Retrieval from downloading data. Disable the feature for data downloads, or check your security/router software for how to make an exception for Telnet or the AIQ Data Retrieval application.
Update to fix holiday issues for Dial/Data
Issue: the holiday dates of 1/2/23 and 6/19/23 may have duplicated data from the prior trading day populating the fields. A patch file fixes this.
Solution: before downloading the fix, make sure all AIQ applications are closed. Download the file and save it to your /wintes32 folder, overwriting the prior version: [ADD LINK — AIQlib32.dll download URL missing from old page]. No other changes are required.
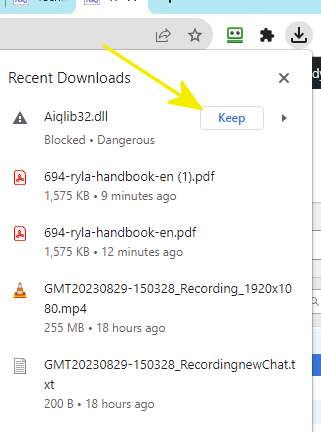
Some browsers download to another location automatically (e.g., your Downloads folder) — locate AIQlib32.dll and copy it to the /wintes32 folder, overwriting the existing version. If your browser blocks the download as dangerous, select Keep. Here's Chrome's example:
Portfolio Manager
How can I transfer my accounts from Profit Manager to Portfolio Manager?
- Open Portfolio Manager and, from the View command on the menu bar, verify that the Accounts view is selected.
- Click Account → Import Profit Manager Files. The Select Profit Manager Directory dialog appears.
- The folder name Pftdata (winTes32/Pftdata) appears in the upper box — this is where previous versions of TradingExpert stored Profit Manager data. The lower boxes show File name: acclist.acl and Files of Type: Profit Manager Account List.
- In the large window, click the file acclist.acl to select it.
- Click Open to import. A new entry is created for each account file in the Profit Manager Account List; the original files are not destroyed.
- The Profit Manager Stops screen appears next, showing the stops that were in effect for your positions. These become the Default Exit Strategy for the imported accounts (the strategy name shows in the lower text box). Click OK to complete — the imported accounts now appear in the Portfolio Manager Account List.
Reports
Why does the ER shown in the Weighted Action List not match the ER on the chart?
The Weighted Action List looks back 10 days to find the ER shown on the report. While looking at the chart, use the left arrow to click back — the ER will have occurred sometime in the last 10 days.
The Group column is not filled in on the Stock reports — why?
The group reports need to be generated at the same time as the stock reports for the Group column to appear in the Stock reports.
The Access plot is not appearing on the Market Log — what do I need to do?
Click Report → Global Properties and place a check on Compute Access.
Market Log — explanation and interpretation
It is not unusual at all for the Market Log's Access plot to disagree with the market section or the group rotation — in fact, that's more common than not. The Market Log gives a complete look into all areas found to give market insight.
The Access plot looks at all the stocks in your system and determines, for each indicator, positive or negative; the arrows correspond to the percentage of all stocks that are positive or negative. Since breadth usually leads the market, this is an early-warning or anticipatory indication of what might come.
The market plot section looks at the current conditions of the DJIA market indicators — generally slightly early to slightly lagging current conditions. The sector rotation is built on Trend Score, which tries to determine strength of trend and is therefore more of a lagging or confirming indication.
The proper way to use the Market Log is a combination view:
- Get an early indication that current market direction may change with a shift in the Access plot.
- Within a few days, the market plot shows a change.
- Full confirmation arrives with sector rotation.
Also in the Market Log are the US, WAL, GS, and DTS. US and WAL tend to be a 1-2 early warning (values of 75 or greater), and day-to-day changes in TS and DTS also provide a good indication of internal changes.
Access plot — calculation and interpretation
The Access plot is calculated as follows: the database is defined using the Master Ticker List (all stocks in the database) or any list structure, including group/sector structures — set in the global parameters of Reports. For each stock, all listed indicators are calculated and then summarized as the percentage of stocks with increasing values for those indicators. The arrows are a graphical representation of that summary.
Access was devised as a breadth indication of your personal database: it looks at what is happening internally with the indicators of every stock you follow, revealing participation (or lack of it). Like breadth indicators for markets, this can be a powerful tool for spotting divergences at market tops and bottoms.
The Market Log and Access plot don't tell you much on a single day — review daily and compare against the last 3–4 days to get a feel for conditions and changes. You can also optimize the Market Log for different market conditions: create a narrower list of 200–700 stocks that are the major movers in the current market and watch participation within that group. Divergences that show up may be less dramatic, but carry more meaning — these stocks have been the darlings, and if they're not participating, something is wrong. Or broaden your approach: keep the same database but look for extreme changes.
Expert Design Studio
How can I automatically update my EDS reports after download?
In Data Retrieval, click EDS Post Processing. Click Add to add the EDS files you want updated after the download.
How can I run an EDS report on weekly data?
In EDS, click File → Properties and change from Daily to Weekly.
I only want to run an EDS report on mutual funds — how can I set this up?
In EDS, click File → Properties. Remove the check from Stocks and add a check to Mutual Funds.
Why is the date on the toolbar not set to the current day?
The toolbar date shows the last day the report was run. To run for the current day, simply change the date.
The toolbar with the date and other buttons has disappeared — how can I get it back?
Close EDS. Delete the file AIQeds.ini from the Windows folder. When you reopen EDS, the toolbar will be back.
While processing through the stocks the program locks or gives a GPF — how can I fix this?
Open Data Manager, click Utilities → Check Ticker Data. Deselect all choices except "Fix Start Dates." Once finished, run the EDS strategy again.
Is there a tutorial on EDS?
Yes — see the EDS tutorials in the Education section.
System Messages
Explanation of the messages in the System Message log
"Incomplete or missing data for ABCD" — indicates a ticker that is no longer trading. Trading could be halted, the ticker delisted, or a merger completed.
"ABCD 04/14/99: 25% variance from prior values" — may be a genuine 25% move in the ticker, or a data spike. Tickers trading below $2 may show these variances every day. Look at the chart to determine whether action is required.
"Group HOUSE2 is empty and was deactivated" — AIQ groups and sectors are calculated from tickers in your Master List. If a group contains no stocks, the system deactivates it.
"WFC has volatility range error. Check data for accuracy" — AIQ performs a volatility check on all tickers when reports run, flagging symbols outside the normalized range. This may indicate a data spike; check the chart, as it may also be genuine extreme volatility.
"APSO 10/15/98: no volume" — the ticker reported fewer than 500 shares traded in the day. Low-volume tickers do not give accurate ERs. Consider using the Advanced Ticker Delete function (Data Manager → Ticker → Delete → Advanced, then set a volume figure on the price/volume screening page) to remove low-volume stocks.
How often should I review System Messages?
At least once a week.
Should I delete System Messages?
Yes — clear the message log after each review. If it isn't cleared, it grows in size and becomes unmanageable.
I get "failed to get syslog.exe after exec" after download — how do I correct this?
In Data Retrieval, do not select "Erase Messages" alone. You can choose "Erase Messages" if you also choose "Print Messages," but it should not be the only message option selected.
Quotes
RTAlerts and Quotes errors — some tickers may be causing crashing issues
If you follow these tickers, remove the existing ticker and add it again with -QB after the symbol — for example, DIA becomes DIA-QB. Tickers requiring the change: LABU, MDY, OIH, SPXL, XLC, XLF, XLK, XLRE, VIG, CGW, YPF, DIA.
How can I add or delete columns?
Right-click on a column and choose Insert or Remove.
What symbol should I use for Nasdaq stocks?
Use the regular ticker but add -QB to the end, e.g. AAPL-QB.
RTAlerts
How do I filter after-hours trading on RTAlerts charts?
In RTAlerts, click File → Service Setup and check "Only Show Data During Defined Market Hours."
How do I add Alerts?
In RTAlerts, click File → Alert Properties → Edit Alerts. Enter the Alert Code in the Alert Code box, or click Rule Wizard to add Alert Code.
Can I add custom indicators?
Yes. In RTAlerts, click File → Indicator Properties → Custom Indicators. Click Add, choose the Plot Type, and click Next. Give the indicator a description and choose the UDF you want to plot. You can also choose whether to plot the indicator on the price plot.
How do I configure sounds for the Alerts?
In RTAlerts, click File → Alert Properties. Right-click the Alert and choose Add Sound. Choose the .wav file you want associated with the Alert. Repeat for each enabled alert.
How can I add a Price Alert?
Price Alerts are achieved by adding trendlines to the charts:
- Right-click a chart, choose Draw Attributes, and draw the trendline.
- Click File → Alert Properties and edit the Alerts.
- Add the following to the Alert Code:
! Alert me if the last trade of a price bar breaks through my trendline to the downside
TrendlineBreakDn if TrendlineBreakout() < 0.
! Alert me if the last trade of a price bar breaks through my trendline to the upside
TrendlineBreakUp if TrendlineBreakout() > 0.
- Enable the Alerts.
Data Transfer Utility
Does DTU support TC2000 data?
Yes, but only the version 3.0 data format. The current TC2000 version provides a "smart export" that exports version 4.0 data to version 3.0 format. After that completes, use DTU to import the version 3.0 data into TradingExpert.
Does DTU work with the MetaStock file format?
No. DTU supports ASCII, .csv, and TC2000 version 3.0 file formats.
Does DTU support 4-digit year date fields?
Yes. Just choose (within the DTU program) the date formats that contain YY and it will work.
Exported ASCII/.csv files are empty even though the program appears to work — why?
This occurs when TradingExpert has been installed in a directory like Program Files\Wintes32. The program needs to be installed to Wintes32 for DTU to work correctly.
Upgrades & Downloads
Existing TradingExpert Pro monthly Dial/Data lease clients
I want to download a full version of TradingExpert Pro for reinstalling or installing on a new system: FREE — click here.
Questions on adding or removing additional services: call 1-800-332-2999, or (001) 775-832-2798 from outside the U.S., for upgrade pricing.
TradingExpert Pro monthly ICE lease clients
I want to download a full version of TradingExpert Pro for reinstalling or installing on a new system: FREE — click here.
Modifying exchanges and services in my Interactive Data/eSignal account: visit eSignal account maintenance — you'll need your username and password.
You can also email or call IDC:
IDC/DataFeed PRD questions (EOD download): DATAFEEDPRDSupport@theice.com · 770-999-4501, Option 2, Sub-option 1
eSignal streaming data questions: 770-999-4511, press "2" for Technical Support
Contact Us
AIQ Technical Support
support@aiqsystems.com · (775) 747-8404
AIQ Sales
sales@aiqsystems.com · (800) 332-2999 or (001) 775-832-2798
AIQ Mailing Address
1580 Grand Point Way, #34764, Reno, NV 89523
ICE account / billing help
770-999-4511 — press "1" for Billing / Customer Service
IDC/DataFeed PRD questions (EOD download)
DATAFEEDPRDSupport@theice.com · 770-999-4501, Option 1, Sub-option 4
eSignal streaming data questions
eSignal contact form · 770-999-4511, press "2" for Technical Support