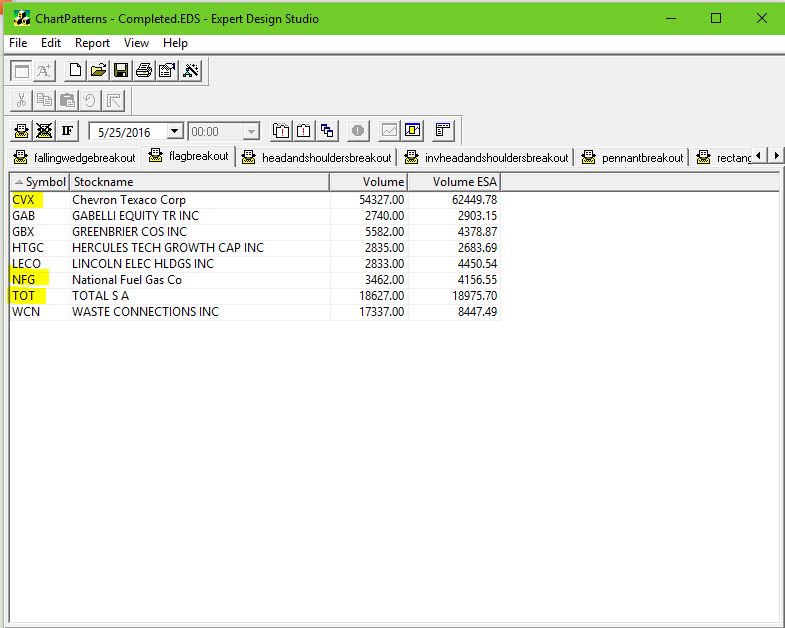
Our Chart pattern Recognition tool had a wealth of gasoline related stocks have breakouts yesterday. The classic flag breakout on good volume could be seen on CVX, NFG and TOT.
Quick reminder on what a flag pattern is.
Usually there’s a strong price movement followed by sideways price movement which is the flag. The pattern is complete when prices breakout in the same direction as the initial price movement. The following move will be in the same direction as the prior sharp move. The move prior to the flag is called the pole.
The flag pattern forms a rectangle with two parallel trendlines that act as support and resistance for the price until the price breaks out. Usually the flag will slope in the opposite direction to the trend.
The buy or sell signal occurs when the price breaks through the support or resistance level, with the trend continuing in the same direction as the pole. The breakthrough should occur on heavier volume.
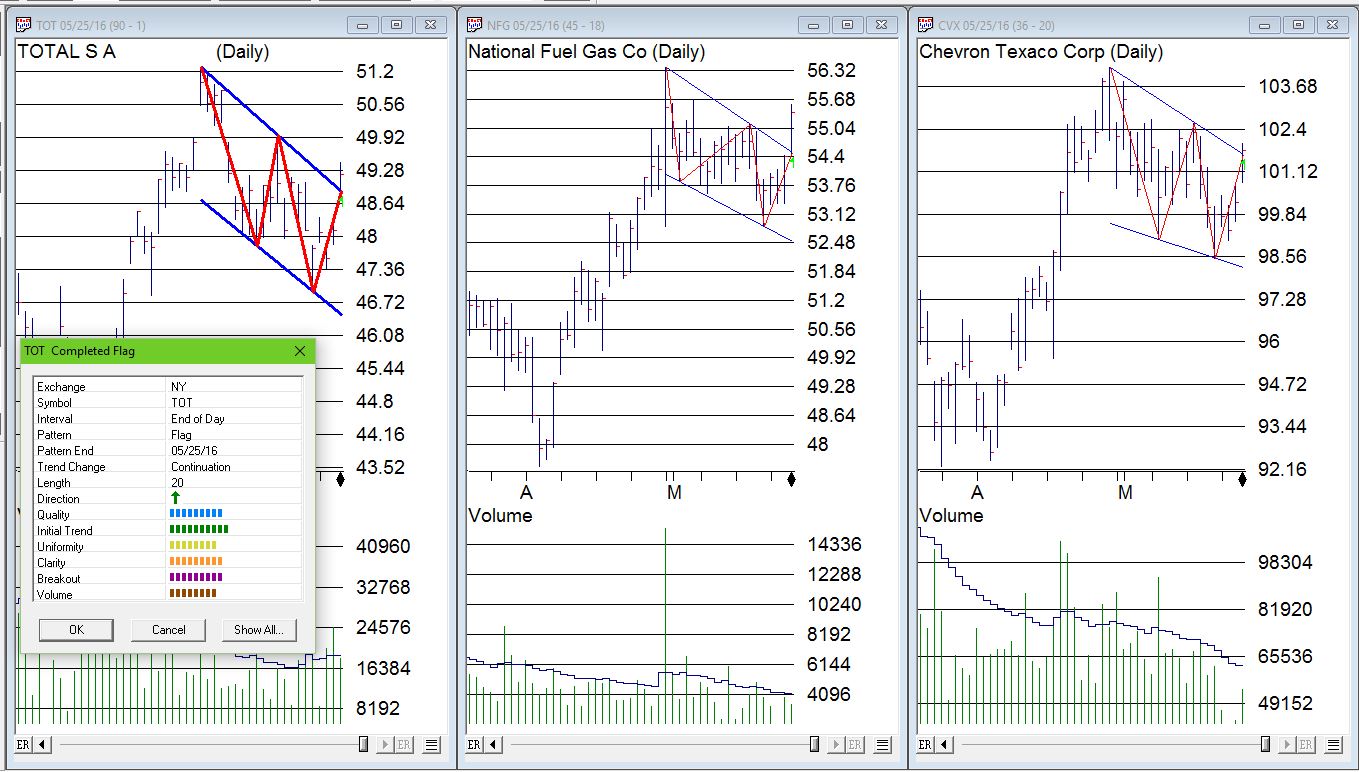
I’ve put all three charts together and you can clearly see the pole, flag and breakout. As noted above the volume on the breakout on TOT was reasonable. The Quality of the pattern was also considered high.
Incidentally the volume on NFG and CVX was not as significant.
The entire list of stocks that generated completed flags in our nightly report on 5/25/16 is below.